
Database System Concepts
7th Edition
ISBN: 9780078022159
Author: Abraham Silberschatz Professor, Henry F. Korth, S. Sudarshan
Publisher: McGraw-Hill Education
expand_more
expand_more
format_list_bulleted
Related questions
Question
the below is an example of diabetes dataset
import matplotlib.pyplot as plt
import numpy as np
from sklearn.datasets import load_diabetes
from sklearn import linear_model
d = load_diabetes()
d_X = d.data[:, np.newaxis, 2]
dx_train = d_X[:-20]
dy_train = d.target[:-20]
dx_test = d_X[-20:]
dy_test = d.target[-20:]
lr = linear_model.LinearRegression()
lr.fit(dx_train, dy_train)
mse = np.mean((lr.predict(dx_test) - dy_test) **2)
lr_score = lr.score(dx_test, dy_test)
print(lr.coef_)
print(mse)
print(lr_score)
plt.scatter(dx_test, dy_test)
plt.plot(dx_test, lr.predict(dx_test), c='r')
plt.show()
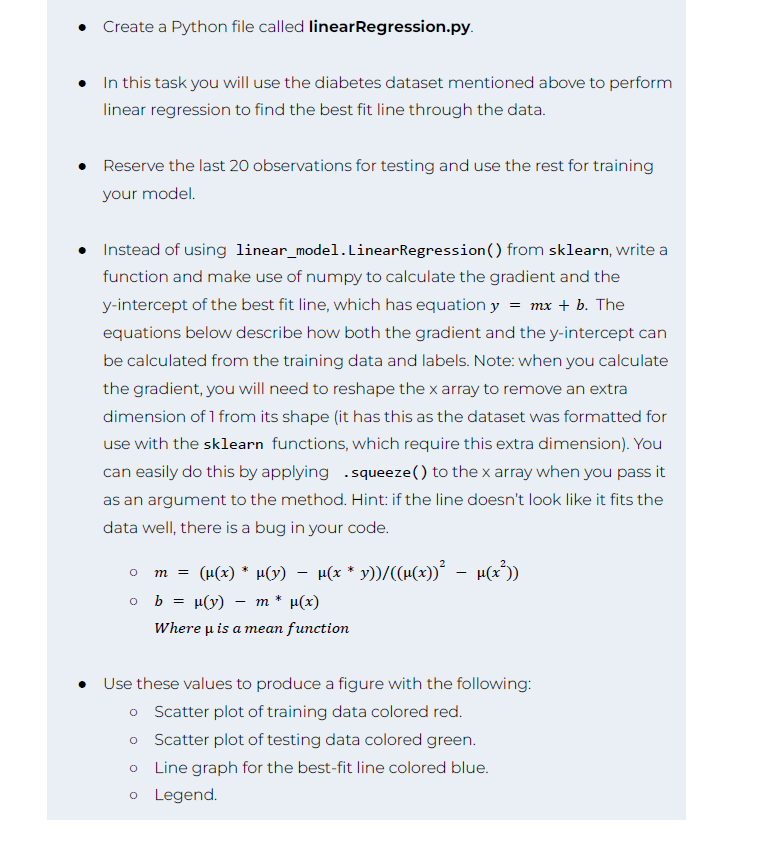

Transcribed Image Text:• Create a Python file called linear Regression.py.
• In this task you will use the diabetes dataset mentioned above to perform
linear regression to find the best fit line through the data.
Reserve the last 20 observations for testing and use the rest for training
your model.
Instead of using linear_model.LinearRegression () from sklearn, write a
function and make use of numpy to calculate the gradient and the
y-intercept of the best fit line, which has equation y = mx + b. The
equations below describe how both the gradient and the y-intercept can
be calculated from the training data and labels. Note: when you calculate
the gradient, you will need to reshape the x array to remove an extra
dimension of 1 from its shape (it has this as the dataset was formatted for
use with the sklearn functions, which require this extra dimension). You
can easily do this by applying squeeze () to the x array when you pass it
as an argument to the method. Hint: if the line doesn't look like it fits the
data well, there is a bug in your code.
0 m = (µ(x) * µ(y) − µ(x * y))/((µ(x))² − µ(x²))
-
o b = µ(y) = m* µ(x)
Where u is a mean function
• Use these values to produce a figure with the following:
o Scatter plot of training data colored red.
o Scatter plot of testing data colored green.
O Line graph for the best-fit line colored blue.
o Legend.
Expert Solution
This question has been solved!
Explore an expertly crafted, step-by-step solution for a thorough understanding of key concepts.

This is a popular solution

Trending nowThis is a popular solution!

Step by stepSolved in 4 steps with 3 images

Knowledge Booster


Learn more about
Need a deep-dive on the concept behind this application? Look no further. Learn more about this topic, computer-science and related others by exploring similar questions and additional content below.Similar questions
- def upgrade_stations(threshold: int, num_bikes: int, stations: List["Station"]) -> int: """Modify each station in stations that has a capacity that is less than threshold by adding num_bikes to the capacity and bikes available counts. Modify each station at most once. Return the total number of bikes that were added to the bike share network. Precondition: num_bikes >= 0arrow_forwardQuestion 6 Which of the followings is a representation for the set {x | a < x < b} [a,b) (a,b] (a,b) [a,b] Moving to another question will save this response. charrow_forwardWhat kind of function is map? higher ordered function: filter higher ordered function: composition higher order function: pipeline higher ordered function: apply-to-allarrow_forward
arrow_back_ios
arrow_forward_ios
Recommended textbooks for you
- Database System ConceptsComputer ScienceISBN:9780078022159Author:Abraham Silberschatz Professor, Henry F. Korth, S. SudarshanPublisher:McGraw-Hill Education
 Starting Out with Python (4th Edition)Computer ScienceISBN:9780134444321Author:Tony GaddisPublisher:PEARSON
 Digital Fundamentals (11th Edition)Computer ScienceISBN:9780132737968Author:Thomas L. FloydPublisher:PEARSON
  C How to Program (8th Edition)Computer ScienceISBN:9780133976892Author:Paul J. Deitel, Harvey DeitelPublisher:PEARSON
 Database Systems: Design, Implementation, & Manag...Computer ScienceISBN:9781337627900Author:Carlos Coronel, Steven MorrisPublisher:Cengage Learning
 Programmable Logic ControllersComputer ScienceISBN:9780073373843Author:Frank D. PetruzellaPublisher:McGraw-Hill Education
Database System Concepts
Computer Science
ISBN:9780078022159
Author:Abraham Silberschatz Professor, Henry F. Korth, S. Sudarshan
Publisher:McGraw-Hill Education
Starting Out with Python (4th Edition)
Computer Science
ISBN:9780134444321
Author:Tony Gaddis
Publisher:PEARSON
Digital Fundamentals (11th Edition)
Computer Science
ISBN:9780132737968
Author:Thomas L. Floyd
Publisher:PEARSON
C How to Program (8th Edition)
Computer Science
ISBN:9780133976892
Author:Paul J. Deitel, Harvey Deitel
Publisher:PEARSON
Database Systems: Design, Implementation, & Manag...
Computer Science
ISBN:9781337627900
Author:Carlos Coronel, Steven Morris
Publisher:Cengage Learning
Programmable Logic Controllers
Computer Science
ISBN:9780073373843
Author:Frank D. Petruzella
Publisher:McGraw-Hill Education