The below shown graph is drawn from the tabulated values of brass which we measured during the experiment of thermal conductivity: (Consider the value of heater power (Q) and the area of cross section (A) of the materia from the tabulated values) X-axis 1 unit = 1cm y-axis 1 unit =5°c 90 80- 70- 60 50 40 30- 20- 10- x cm 1. 4. Distance of the test point from the hot end in centimeter 3 5 9 10 Calculate the following; Thermal conductivity of brass Calculated quantities Value Difference in temperature (AT) C* (with sign) Difference in distance between test points (Ax) cm Slope from the graph "C/m (with sign) Thermal conductivity of brass k, W/m'C Temperature in degree celsius
The below shown graph is drawn from the tabulated values of brass which we measured during the experiment of thermal conductivity: (Consider the value of heater power (Q) and the area of cross section (A) of the materia from the tabulated values) X-axis 1 unit = 1cm y-axis 1 unit =5°c 90 80- 70- 60 50 40 30- 20- 10- x cm 1. 4. Distance of the test point from the hot end in centimeter 3 5 9 10 Calculate the following; Thermal conductivity of brass Calculated quantities Value Difference in temperature (AT) C* (with sign) Difference in distance between test points (Ax) cm Slope from the graph "C/m (with sign) Thermal conductivity of brass k, W/m'C Temperature in degree celsius

Physics for Scientists and Engineers: Foundations and Connections
1st Edition
ISBN:9781133939146
Author:Katz, Debora M.
Publisher:Katz, Debora M.
Chapter28: Current And Resistance
Section: Chapter Questions
Problem 58PQ

Related questions
Question
Can you help me please..
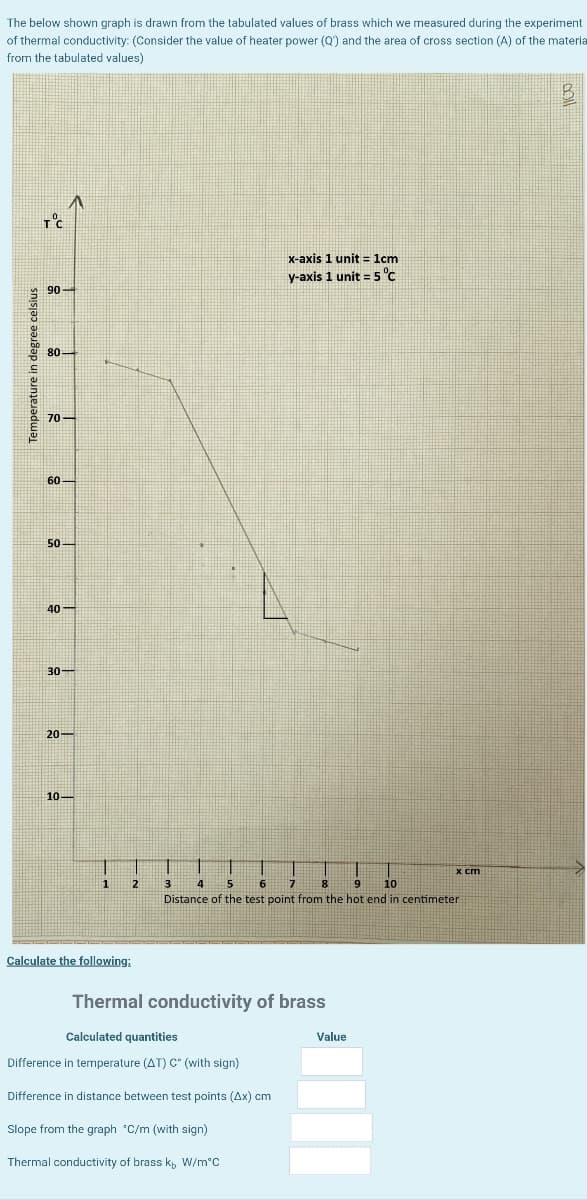
Transcribed Image Text:The below shown graph is drawn from the tabulated values of brass which we measured during the experiment
of thermal conductivity: (Consider the value of heater power (Q') and the area of cross section (A) of the materia
from the tabulated values)
x-axis 1 unit = 1cm
y-axis 1 unit=5 °C
90
70 -
60–
50-
40 -
30-
20-
10-
x cm
2
3
4
6
8.
9
10
Distance of the test point from the hot end in centimeter
Calculate the following;
Thermal conductivity of brass
Calculated quantities
Value
Difference in temperature (AT) C" (with sign)
Difference in distance between test points (Ax) cm
Slope from the graph *C/m (with sign)
Thermal conductivity of brass k, W/m°C
Temperature in degree celsius
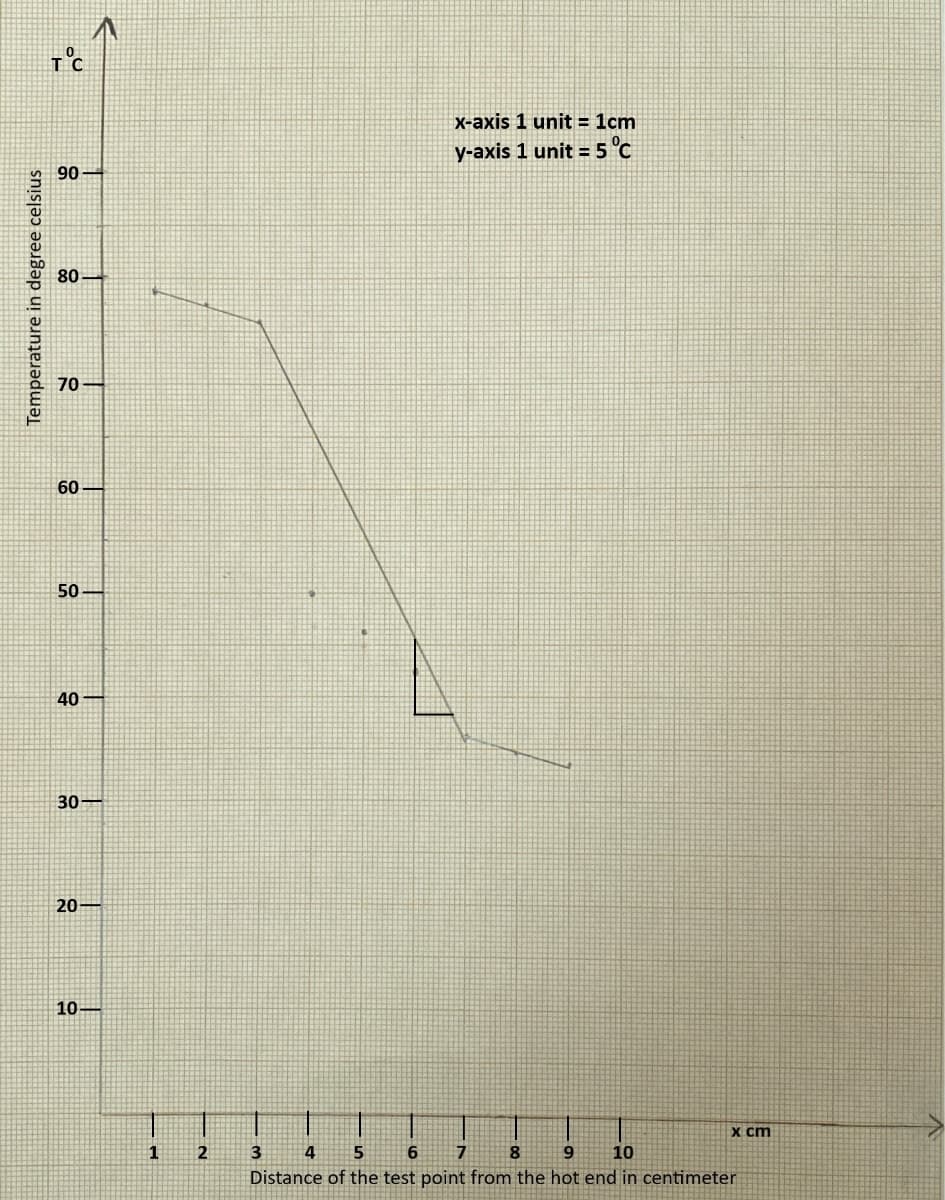
Transcribed Image Text:x-axis 1 unit = 1cm
y-axis 1 unit = 5 °C
90
80
70
60
50
40
30
20
10
x ст
1
2
3
4
7
8.
9.
10
Distance of the test point from the hot end in centimeter
Temperature in degree celsius
Expert Solution
This question has been solved!
Explore an expertly crafted, step-by-step solution for a thorough understanding of key concepts.

Step by step
Solved in 4 steps with 1 images

Knowledge Booster


Learn more about
Need a deep-dive on the concept behind this application? Look no further. Learn more about this topic, physics and related others by exploring similar questions and additional content below.Recommended textbooks for you
Physics for Scientists and Engineers: Foundations…
Physics
ISBN:
9781133939146
Author:
Katz, Debora M.
Publisher:
Cengage Learning
Physics for Scientists and Engineers: Foundations…
Physics
ISBN:
9781133939146
Author:
Katz, Debora M.
Publisher:
Cengage Learning