The below shown graph is drawn from the tabulated values of brass which we measured during the experiment of thermal conductivity: (Consider the value of heater power (Q') and the area of cross section (A) of the material from the tabulated values) Hsi unit - lom va1 unt st 40- Dtanf the frumthe Calculate the following: Thermal conductivity of brass Calculated quantities Value Difference in temperature (AT) C° (with sign) Difference in distance between test points (Ax) cm Slope from the graph °C/m (with sign) inso ap u aind
The below shown graph is drawn from the tabulated values of brass which we measured during the experiment of thermal conductivity: (Consider the value of heater power (Q') and the area of cross section (A) of the material from the tabulated values) Hsi unit - lom va1 unt st 40- Dtanf the frumthe Calculate the following: Thermal conductivity of brass Calculated quantities Value Difference in temperature (AT) C° (with sign) Difference in distance between test points (Ax) cm Slope from the graph °C/m (with sign) inso ap u aind

Chapter1: Temperature And Heat
Section: Chapter Questions
Problem 99P: Some stove tops are smooth ceramic for easy cleaning. If the ceramic is 0.600 cm thick and heat...

Related questions
Question
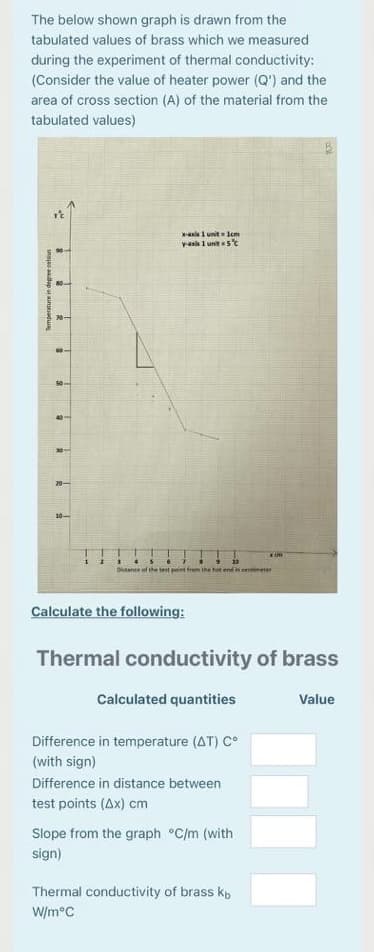
Transcribed Image Text:The below shown graph is drawn from the
tabulated values of brass which we measured
during the experiment of thermal conductivity:
(Consider the value of heater power (Q') and the
area of cross section (A) of the material from the
tabulated values)
-als i unit lem
va 1 unit st
20-
20-
10-
Dtae of the test pint fm the hat end in eentineter
Calculate the following:
Thermal conductivity of brass
Calculated quantities
Value
Difference in temperature (AT) C°
(with sign)
Difference in distance between
test points (Ax) cm
Slope from the graph °C/m (with
sign)
Thermal conductivity of brass kp
W/m°C
snsjao aapur aintadu
Expert Solution
This question has been solved!
Explore an expertly crafted, step-by-step solution for a thorough understanding of key concepts.

Step by step
Solved in 3 steps with 1 images

Knowledge Booster


Learn more about
Need a deep-dive on the concept behind this application? Look no further. Learn more about this topic, physics and related others by exploring similar questions and additional content below.Recommended textbooks for you