The below shown graph is drawn from the tabulated values of brass which we measured during the experiment of thermal conductivity: (Consider the value of heater power (Q') and the area of cross section (A) of the material from the tabulated values) T'C N-axis 1 unit lem v-axis 1 unit s'C 90 80 70- 60- so- 40 30- 20- 10- Distance of the test point from the hot end in centimeter Calculate the following: Thermal conductivity of brass Calculated Value quantities Difference in temperature (AT) C° (with sign) Difference in distance between test points (Ax) cm Slope from the graph °C/m (with sign) Thermal conductivity of brass kp W/m°C
The below shown graph is drawn from the tabulated values of brass which we measured during the experiment of thermal conductivity: (Consider the value of heater power (Q') and the area of cross section (A) of the material from the tabulated values) T'C N-axis 1 unit lem v-axis 1 unit s'C 90 80 70- 60- so- 40 30- 20- 10- Distance of the test point from the hot end in centimeter Calculate the following: Thermal conductivity of brass Calculated Value quantities Difference in temperature (AT) C° (with sign) Difference in distance between test points (Ax) cm Slope from the graph °C/m (with sign) Thermal conductivity of brass kp W/m°C

Chapter1: Temperature And Heat
Section: Chapter Questions
Problem 128CP: As the very first rudiment of climatology, estimate the temperature of Earth. Assume it is a perfect...

Related questions
Question
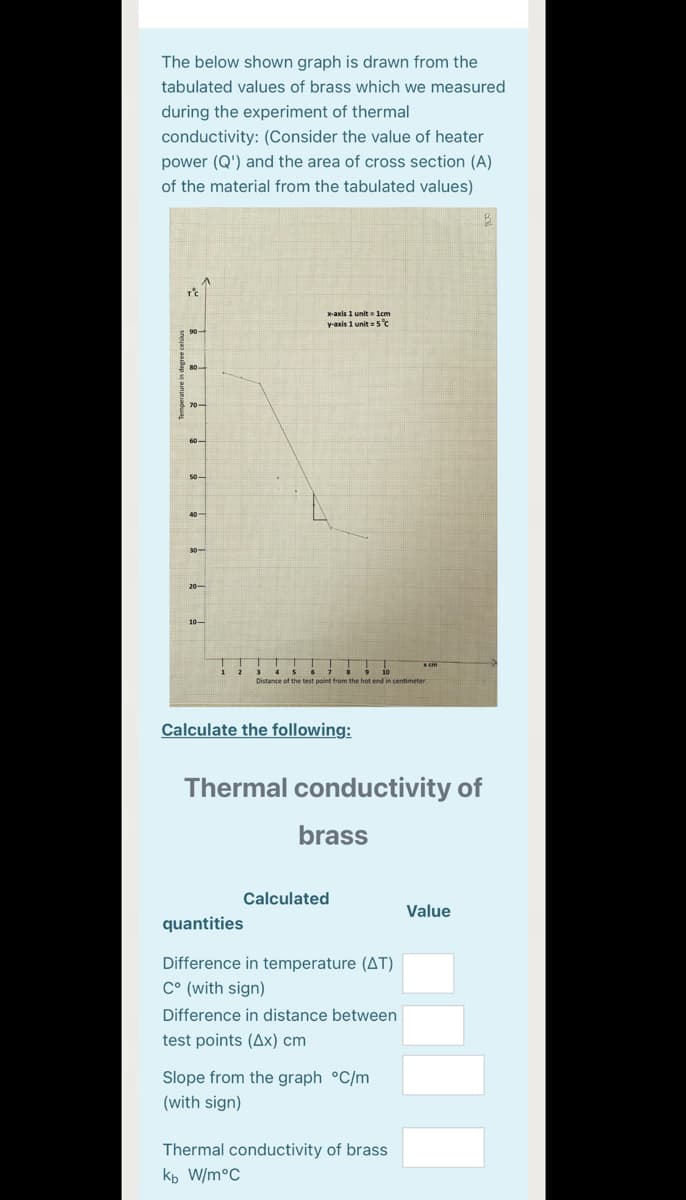
Transcribed Image Text:The below shown graph is drawn from the
tabulated values of brass which we measured
during the experiment of thermal
conductivity: (Consider the value of heater
power (Q') and the area of cross section (A)
of the material from the tabulated values)
X-axis 1 unit lcm
y-axis 1 unit =5°C
30-
20-
10-
Distance of the test point from the hot end in centimeter
Calculate the following:
Thermal conductivity of
brass
Calculated
Value
quantities
Difference in temperature (AT)
C° (with sign)
Difference in distance between
test points (Ax) cm
Slope from the graph °C/m
(with sign)
Thermal conductivity of brass
kь W/m°C
Expert Solution
This question has been solved!
Explore an expertly crafted, step-by-step solution for a thorough understanding of key concepts.

Step by step
Solved in 2 steps with 1 images

Knowledge Booster


Learn more about
Need a deep-dive on the concept behind this application? Look no further. Learn more about this topic, physics and related others by exploring similar questions and additional content below.Recommended textbooks for you