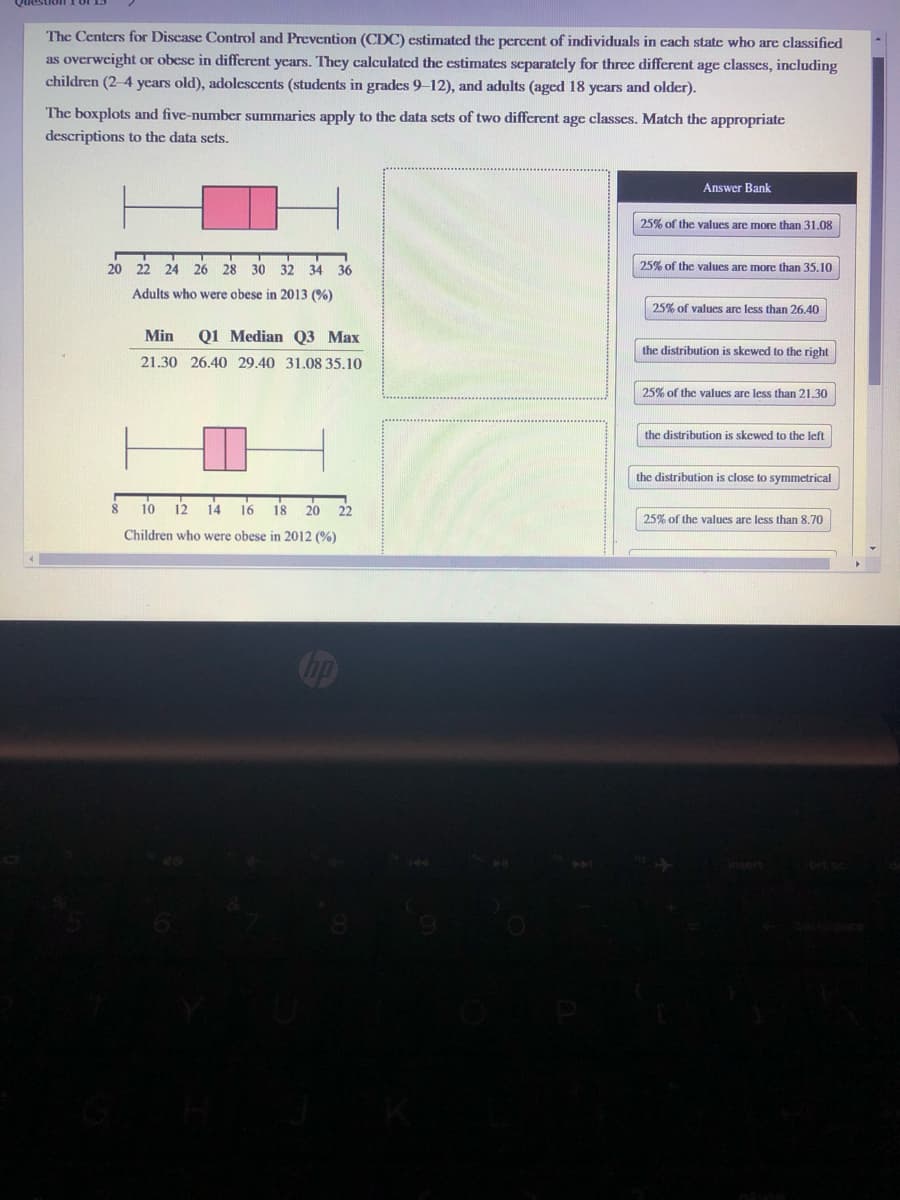
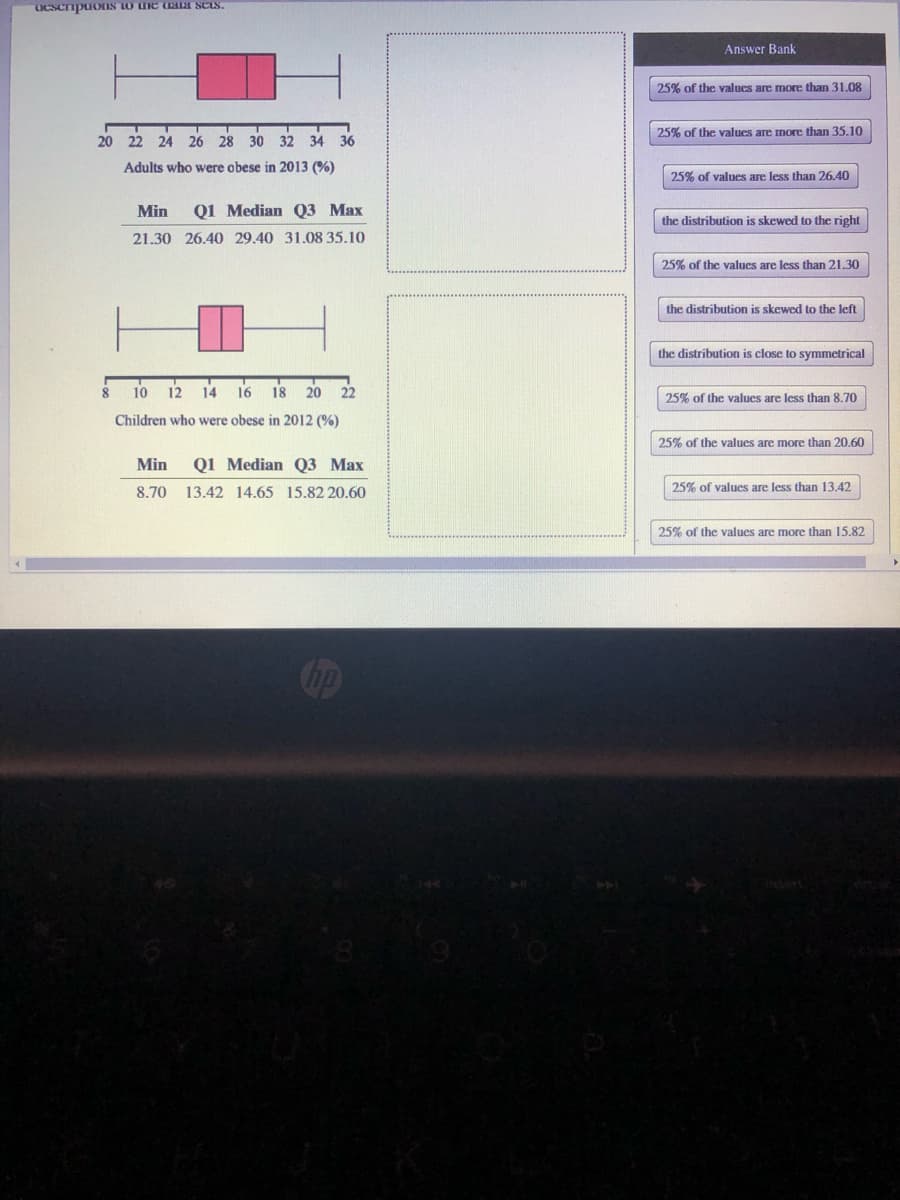
The Centers for Discase Control and Prevention (CDC) estimated the percent of individuals in cach state who are classified as overweight or obese in different years. They calculated the estimates separately for three different age classes, including children (2-4 years old), adolescents (students in grades 9-12), and adults (aged 18 years and older). The boxplots and five-number summaries apply to the data sets of two different age classes. Match the appropriate descriptions to the data sets. Answer Bank 25% of the values are more than 31.08 20 22 24 26 28 30 32 34 36 25% of the values are more than 35.10 Adults who were obese in 2013 (%) 25% of values are less than 26.40 Min QI Median Q3 Max the distribution is skewed to the right 21.30 26.40 29.40 31.08 35.10 25% of the values are less than 21.30 T the distribution is skewed to the left the distribution is close to symmetrical 10 12 14 16 18 20 22 25% of the values are less than 8.70 Child 20124 R


Inverse Normal Distribution
The method used for finding the corresponding z-critical value in a normal distribution using the known probability is said to be an inverse normal distribution. The inverse normal distribution is a continuous probability distribution with a family of two parameters.
Mean, Median, Mode
It is a descriptive summary of a data set. It can be defined by using some of the measures. The central tendencies do not provide information regarding individual data from the dataset. However, they give a summary of the data set. The central tendency or measure of central tendency is a central or typical value for a probability distribution.
Z-Scores
A z-score is a unit of measurement used in statistics to describe the position of a raw score in terms of its distance from the mean, measured with reference to standard deviation from the mean. Z-scores are useful in statistics because they allow comparison between two scores that belong to different normal distributions.


Trending now
This is a popular solution!

Step by step
Solved in 2 steps with 2 images


