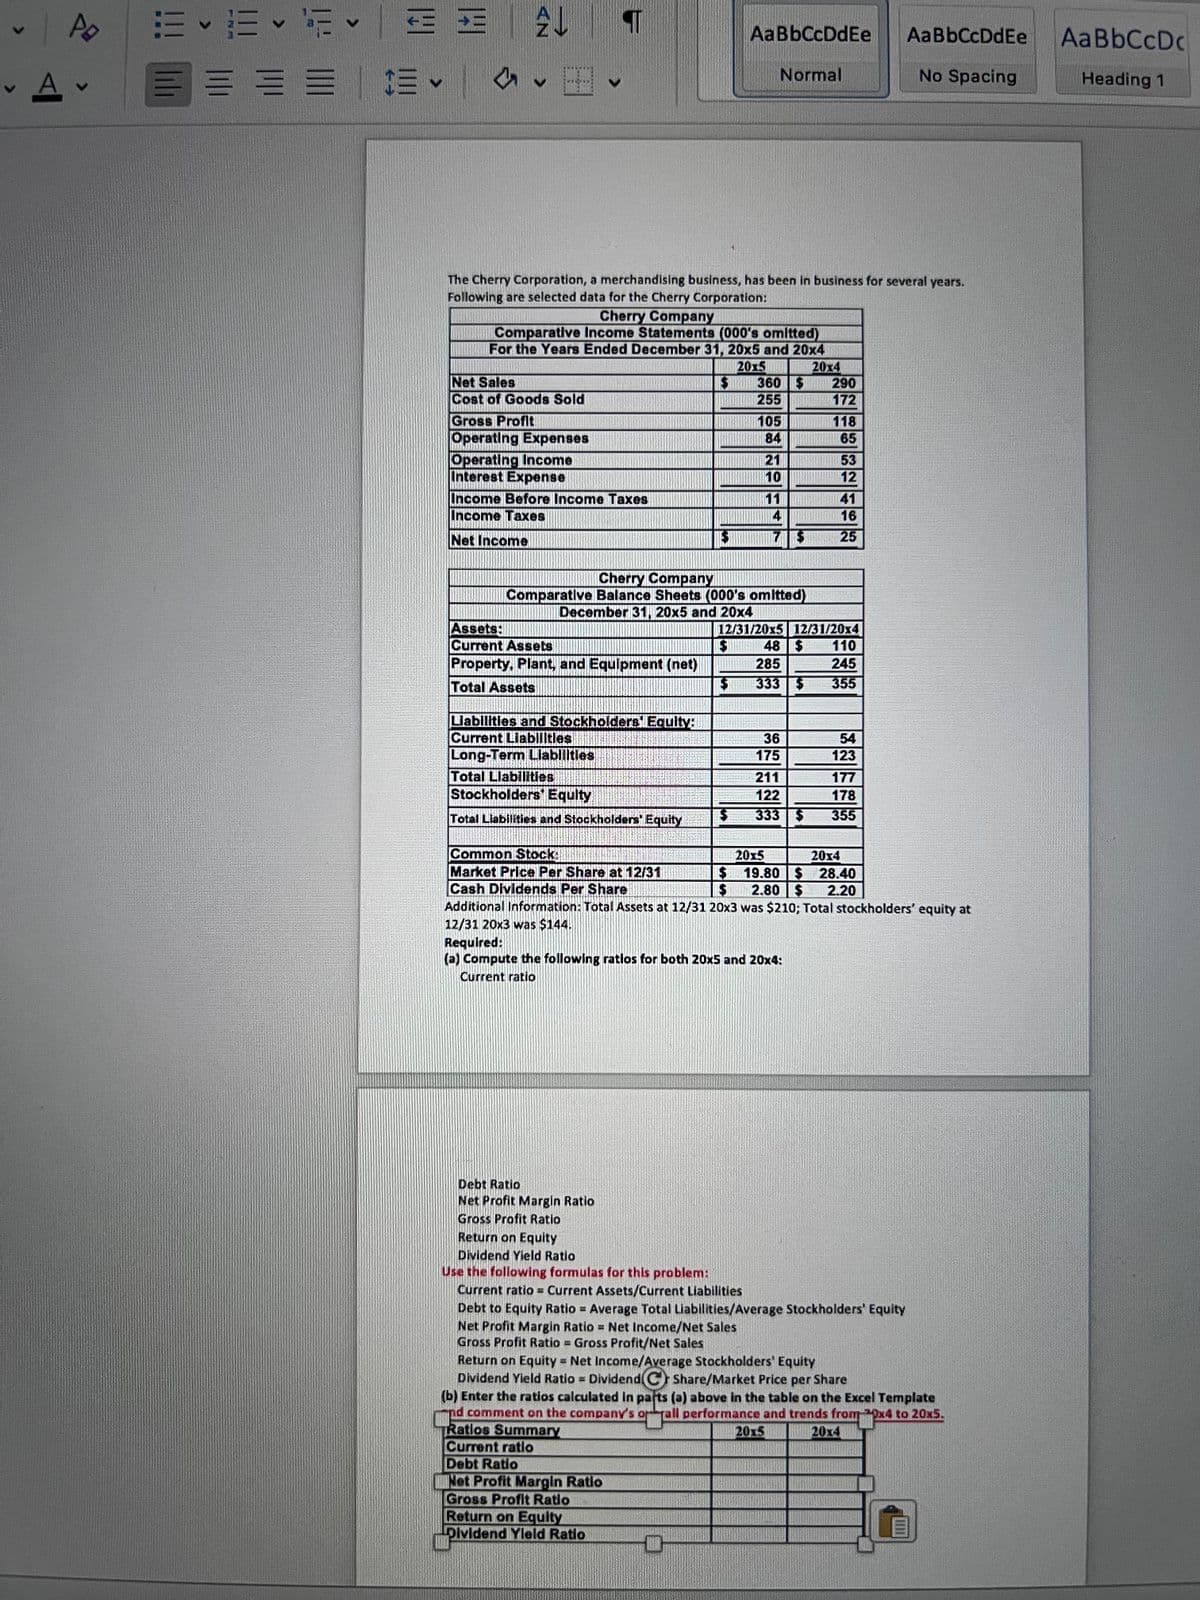
The Cherry Corporation, a merchandising business, has been in business for several years. Following are selected data for the Cherry Corporation: Cherry Company Comparative Income Statements (000's omitted) For the Years Ended December 31, 20x5 and 20x4 20x4 20x5 $360 $ Net Sales Cost of Goods Sold 255 Gross Profit 105 Operating Expenses 84 Operating Income 21 Interest Expense 10 Income Before Income Taxes 11 Income Taxes Net Income Assets: Current Assets Property, Plant, and Equipment (net) Total Assets Liabilities and Stockholders Equity: Current Liabilities Long-Term Liabilities Total Liabilities Stockholders' Equity Total Liabilities and Stockholders' Equity Common Stock: 20x5 20x4 Market Price Per Share at 12/31 $19.80 $ 28.40 Cash Dividends Per Share $ 2.80 $ 2.20 Additional Information: Total Assets at 12/31 20x3 was $210; Total stockholders' equity at 12/31 20x3 was $144. Required: (a) Compute the following ratios for both 20x5 and 20x4: Current ratio Debt Ratio Net Profit Margin Ratio Gross Profit Ratio Return on Equity Dividend Yield Ratio Use the following formulas for this problem: Current ratio= Current Assets/Current Liabilities Debt to Equity Ratio = Average Total Liabilities/Average Stockholders' Equity Net Profit Margin Ratio - Net Income/Net Sales Gross Profit Ratio - Gross Profit/Net Sales Return on Equity Net Income/Average Stockholders' Equity Dividend Yield Ratio - Dividend(C) Share/Market Price per Share (b) Enter the ratios calculated in parts (a) above in the table on the Excel Template nd comment on the company's orall performance and trends from 9x4 to 20x5. TRatios Summary 20x5 20x4 Current ratio Debt Ratio Net Profit Margin Ratio Gross Profit Ratio 290 172 118 65 53 12 41 16 25 12/31/20x5 12/31/20x4 $ 48 $ 110 285 245 $ 333 $ 355 36 54 175 123 211 177 122 178 333 $ 355 4 7 $ Cherry Company Comparative Balance Sheets (000's omitted) December 31, 20x5 and 20x4 $ $


Reporting Cash Flows
Reporting of cash flows means a statement of cash flow which is a financial statement. A cash flow statement is prepared by gathering all the data regarding inflows and outflows of a company. The cash flow statement includes cash inflows and outflows from various activities such as operating, financing, and investment. Reporting this statement is important because it is the main financial statement of the company.
Balance Sheet
A balance sheet is an integral part of the set of financial statements of an organization that reports the assets, liabilities, equity (shareholding) capital, other short and long-term debts, along with other related items. A balance sheet is one of the most critical measures of the financial performance and position of the company, and as the name suggests, the statement must balance the assets against the liabilities and equity. The assets are what the company owns, and the liabilities represent what the company owes. Equity represents the amount invested in the business, either by the promoters of the company or by external shareholders. The total assets must match total liabilities plus equity.
Financial Statements
Financial statements are written records of an organization which provide a true and real picture of business activities. It shows the financial position and the operating performance of the company. It is prepared at the end of every financial cycle. It includes three main components that are balance sheet, income statement and cash flow statement.
Owner's Capital
Before we begin to understand what Owner’s capital is and what Equity financing is to an organization, it is important to understand some basic accounting terminologies. A double-entry bookkeeping system Normal account balances are those which are expected to have either a debit balance or a credit balance, depending on the nature of the account. An asset account will have a debit balance as normal balance because an asset is a debit account. Similarly, a liability account will have the normal balance as a credit balance because it is amount owed, representing a credit account. Equity is also said to have a credit balance as its normal balance. However, sometimes the normal balances may be reversed, often due to incorrect journal or posting entries or other accounting/ clerical errors.


Trending now
This is a popular solution!

Step by step
Solved in 6 steps with 5 images


