The computed test statistic for the appropriate test is O 1.3931 O 3.6426 O -13.2685 O -1.1803
The computed test statistic for the appropriate test is O 1.3931 O 3.6426 O -13.2685 O -1.1803

Holt Mcdougal Larson Pre-algebra: Student Edition 2012
1st Edition
ISBN:9780547587776
Author:HOLT MCDOUGAL
Publisher:HOLT MCDOUGAL
Chapter11: Data Analysis And Probability
Section: Chapter Questions
Problem 8CR

Related questions
Question
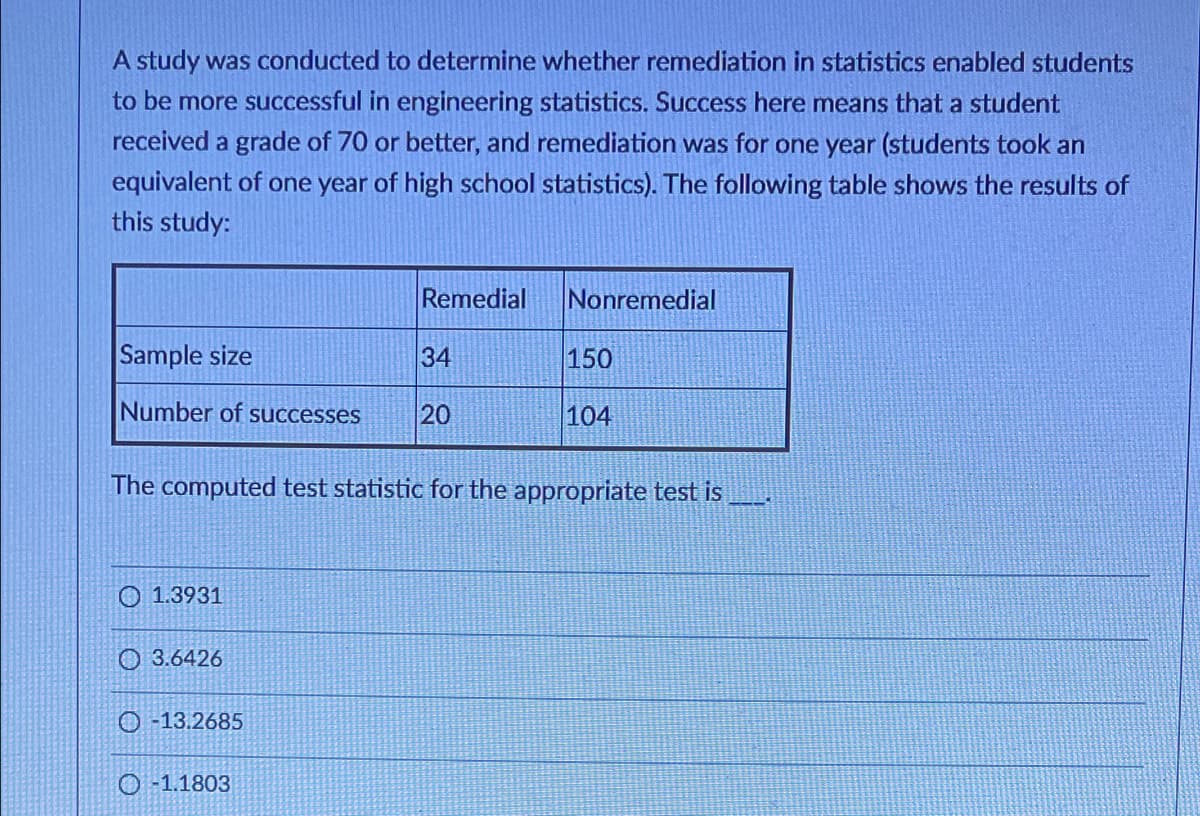
Transcribed Image Text:A study was conducted to determine whether remediation in statistics enabled students
to be more successful in engineering statistics. Success here means that a student
received a grade of 70 or better, and remediation was for one year (students took an
equivalent of one year of high school statistics). The following table shows the results of
this study:
Remedial
Nonremedial
Sample size
34
150
Number of successes
20
104
The computed test statistic for the appropriate test is
O 1.3931
O 3.6426
O -13.2685
O -1.1803
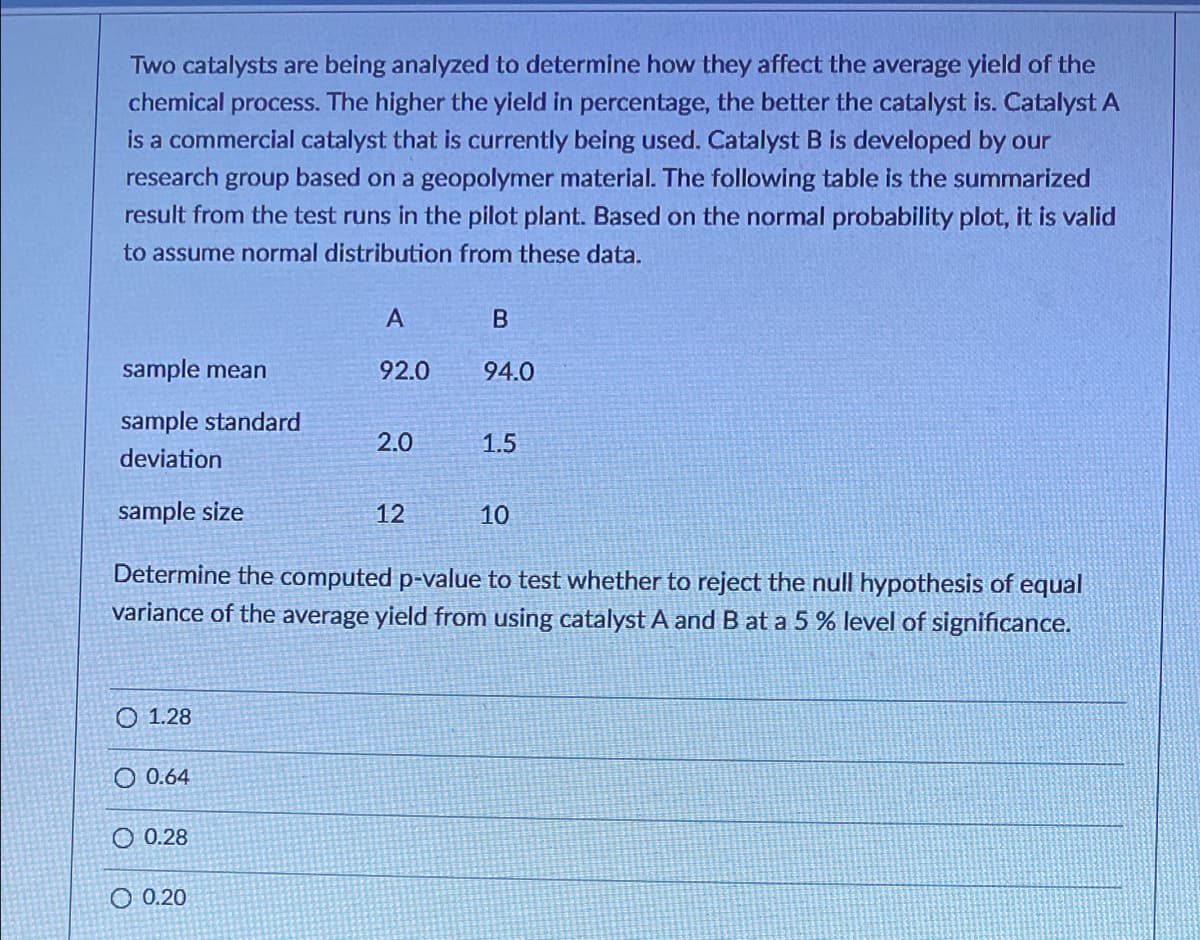
Transcribed Image Text:Two catalysts are being analyzed to determine how they affect the average yield of the
chemical process. The higher the yield in percentage, the better the catalyst is. Catalyst A
is a commercial catalyst that is currently being used. Catalyst B is developed by our
research group based on a geopolymer material. The following table is the summarized
result from the test runs in the pilot plant. Based on the normal probability plot, it is valid
to assume normal distribution from these data.
sample mean
92.0
94.0
sample standard
2.0
1.5
deviation
sample size
12
10
Determine the computed p-value to test whether to reject the null hypothesis of equal
variance of the average yield from using catalyst A and B at a 5 % level of significance.
O 1.28
O 0.64
O 0.28
O 0.20
Expert Solution
This question has been solved!
Explore an expertly crafted, step-by-step solution for a thorough understanding of key concepts.

Step by step
Solved in 2 steps with 1 images

Recommended textbooks for you
Holt Mcdougal Larson Pre-algebra: Student Edition…
Algebra
ISBN:
9780547587776
Author:
HOLT MCDOUGAL
Publisher:
HOLT MCDOUGAL

Glencoe Algebra 1, Student Edition, 9780079039897…
Algebra
ISBN:
9780079039897
Author:
Carter
Publisher:
McGraw Hill
Holt Mcdougal Larson Pre-algebra: Student Edition…
Algebra
ISBN:
9780547587776
Author:
HOLT MCDOUGAL
Publisher:
HOLT MCDOUGAL
Glencoe Algebra 1, Student Edition, 9780079039897…
Algebra
ISBN:
9780079039897
Author:
Carter
Publisher:
McGraw Hill