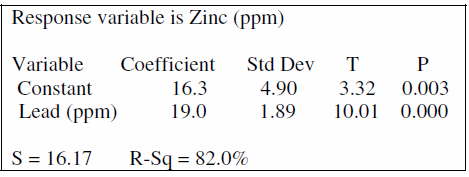
The computer output below shows the result of a linear regression analysis for predicting the concentration of zinc, in parts per million (ppm), from the concentration of lead, in ppm, found in fish from a certain river. Which of the following statements is a correct interpretation of the value 19.0 in the output? On average there is a predicted increase of 19.0 ppm in concentration of lead for every increase of 1 ppm in concentration of zinc found in the fish. On average there is a predicted increase of 19.0 ppm in concentration of zinc for every increase of 1 ppm in concentration of lead found in the fish. The predicted concentration of zinc is 19.0 ppm in fish with no concentration of lead. The predicted concentration of lead is 19.0 ppm in fish with no concentration of zinc. Approximately 19% of the variability in zinc concentration is predicted by its linear relationship with lead concentration.


Correlation
Correlation defines a relationship between two independent variables. It tells the degree to which variables move in relation to each other. When two sets of data are related to each other, there is a correlation between them.
Linear Correlation
A correlation is used to determine the relationships between numerical and categorical variables. In other words, it is an indicator of how things are connected to one another. The correlation analysis is the study of how variables are related.
Regression Analysis
Regression analysis is a statistical method in which it estimates the relationship between a dependent variable and one or more independent variable. In simple terms dependent variable is called as outcome variable and independent variable is called as predictors. Regression analysis is one of the methods to find the trends in data. The independent variable used in Regression analysis is named Predictor variable. It offers data of an associated dependent variable regarding a particular outcome.
The computer output below shows the result of a linear
Which of the following statements is a correct interpretation of the value 19.0 in the output?
- On average there is a predicted increase of 19.0 ppm in concentration of lead for every increase of 1 ppm in concentration of zinc found in the fish.
- On average there is a predicted increase of 19.0 ppm in concentration of zinc for every increase of 1 ppm in concentration of lead found in the fish.
- The predicted concentration of zinc is 19.0 ppm in fish with no concentration of lead.
- The predicted concentration of lead is 19.0 ppm in fish with no concentration of zinc.
- Approximately 19% of the variability in zinc concentration is predicted by its linear relationship with lead concentration.


Trending now
This is a popular solution!

Step by step
Solved in 2 steps with 2 images


