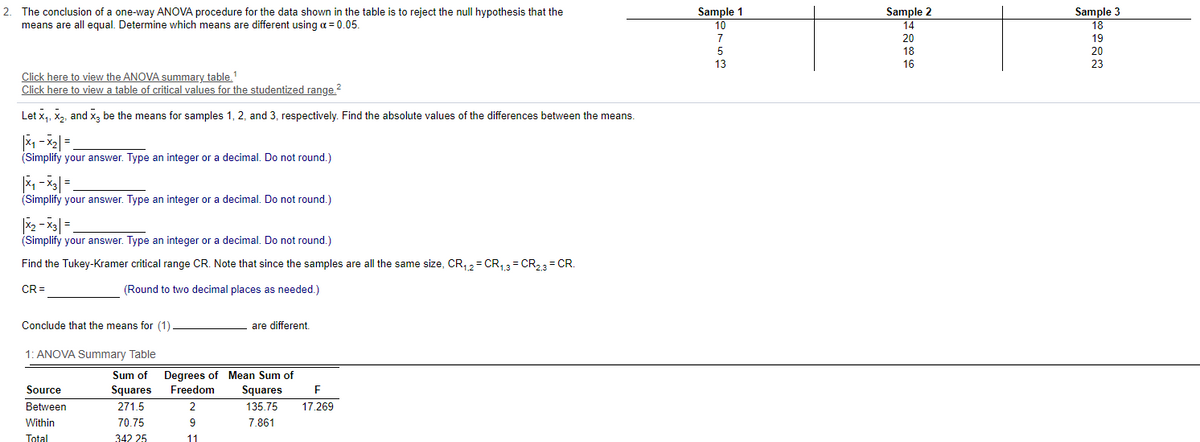
The conclusion of a one-way ANOVA procedure for the data shown in the table is to reject the null hypothesis that the means are all equal. Determine which means are different using a = 0.05. Sample 1 10 Sample 2 14 Sample 3 18 20 19 5 18 20 13 16 23 Click here to view the ANOVA summary table. Click here to view a table of critical values for the studentized range ? Let x,, x, and x, be the means for samples 1, 2, and 3, respectively. Find the absolute values of the differences between the means. (Simplify your answer. Type an integer or a decimal. Do not round.) (Simplify your answer. Type an integer or a decimal. Do not round.) (Simplify your answer. Type an integer or a decimal. Do not round.) Find the Tukey-Kramer critical range CR. Note that since the samples are all the same size, CR, 2 = CR, 3= CR2 = CR. CR = (Round to two decimal places as needed.) Conclude that the means for (1) are different 1: ANOVA Summary Table Sum of Degrees of Mean Sum of Squares 271.5 70.75 Source Freedom Squares Between 135.75 17.269 Within 7.861 Total 342 25 11
The conclusion of a one-way ANOVA procedure for the data shown in the table is to reject the null hypothesis that the means are all equal. Determine which means are different using a = 0.05. Sample 1 10 Sample 2 14 Sample 3 18 20 19 5 18 20 13 16 23 Click here to view the ANOVA summary table. Click here to view a table of critical values for the studentized range ? Let x,, x, and x, be the means for samples 1, 2, and 3, respectively. Find the absolute values of the differences between the means. (Simplify your answer. Type an integer or a decimal. Do not round.) (Simplify your answer. Type an integer or a decimal. Do not round.) (Simplify your answer. Type an integer or a decimal. Do not round.) Find the Tukey-Kramer critical range CR. Note that since the samples are all the same size, CR, 2 = CR, 3= CR2 = CR. CR = (Round to two decimal places as needed.) Conclude that the means for (1) are different 1: ANOVA Summary Table Sum of Degrees of Mean Sum of Squares 271.5 70.75 Source Freedom Squares Between 135.75 17.269 Within 7.861 Total 342 25 11

MATLAB: An Introduction with Applications
6th Edition
ISBN:9781119256830
Author:Amos Gilat
Publisher:Amos Gilat
Chapter1: Starting With Matlab
Section: Chapter Questions
Problem 1P

Related questions
Question
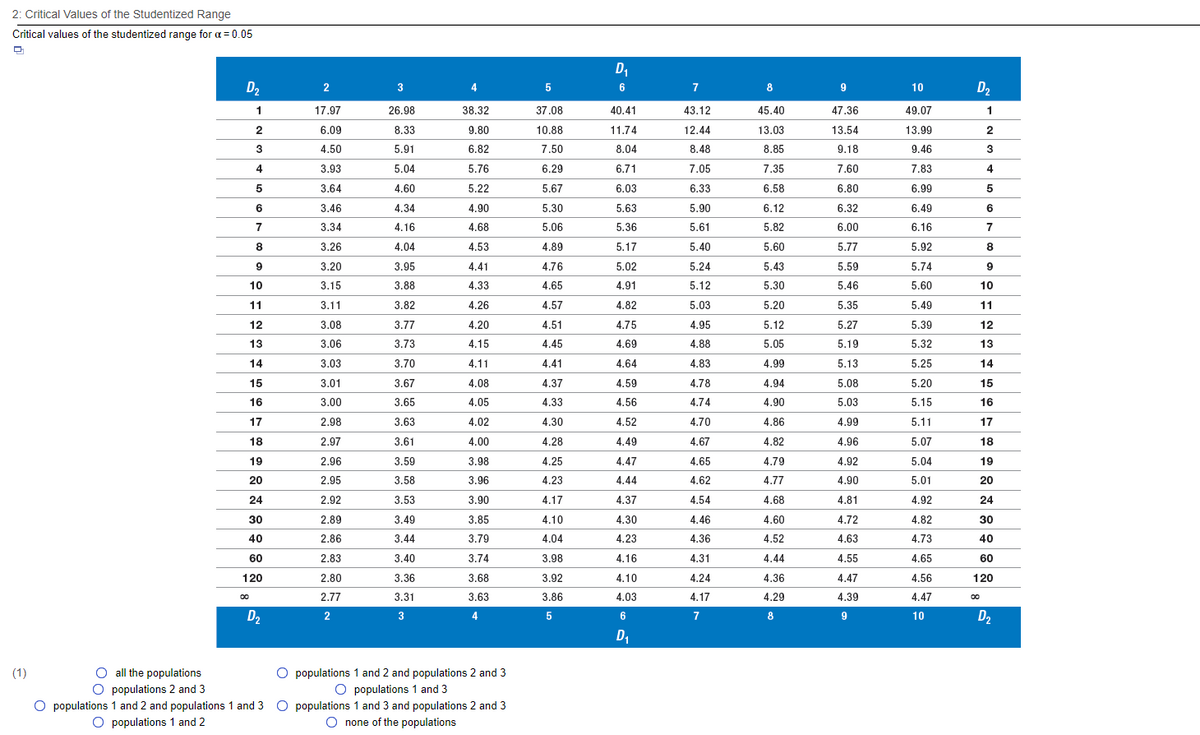
Transcribed Image Text:2: Critical Values of the Studentized Range
Critical values of the studentized range for a = 0.05
D1
D2
2
4
6
7
8
9
10
D2
1
17.97
26.98
38.32
37.08
40.41
43.12
45.40
47.36
49.07
1
2
6.09
8.33
9.80
10.88
11.74
12.44
13.03
13.54
13.99
2
3
4.50
5.91
6.82
7.50
8.04
8.48
8.85
9.18
9.46
3
4
3.93
5.04
5.76
6.29
6.71
7.05
7.35
7.60
7.83
4
5
3.64
4,60
5.22
5.67
6.03
6.33
6.58
6.80
6.99
5
6.
3.46
4.34
4.90
5.30
5.63
5.90
6.12
6.32
6.49
6.
7
3.34
4.16
4.68
5.06
5.36
5.61
5.82
6.00
6.16
7
3.26
4.04
4.53
4.89
5.17
5.40
5.60
5.77
5.92
8
9
3.20
3.95
4.41
4.76
5.02
5.24
5.43
5.59
5.74
9
10
3.15
3.88
4.33
4.65
4.91
5.12
5.30
5.46
5.60
10
11
3.11
3.82
4.26
4.57
4.82
5.03
5.20
5.35
5.49
11
12
3.08
3.77
4.20
4.51
4.75
4.95
5.12
5.27
5.39
12
13
3.06
3.73
4.15
4.45
4.69
4.88
5.05
5.19
5.32
13
14
3.03
3.70
4.11
4.41
4.64
4.83
4.99
5.13
5.25
14
15
3.01
3.67
4.08
4.37
4.59
4.78
4.94
5.08
5.20
15
16
3.00
3.65
4.05
4.33
4.56
4.74
4.90
5.03
5.15
16
17
2.98
3.63
4.02
4.30
4.52
4.70
4.86
4.99
5.11
17
18
2.97
3.61
4.00
4.28
4.49
4.67
4.82
4.96
5.07
18
19
2.96
3.59
3.98
4.25
4.47
4.65
4.79
4.92
5.04
19
20
2.95
3.58
3.96
4.23
4.44
4.62
4.77
4.90
5.01
20
24
2.92
3.53
3.90
4.17
4.37
4.54
4.68
4.81
4.92
24
30
2.89
3.49
3.85
4.10
4.30
4.46
4.60
4.72
4.82
30
40
2.86
3.44
3.79
4.04
4.23
4.36
4.52
4.63
4.73
40
60
2.83
3.40
3.74
3.98
4.16
4.31
4.44
4.55
4.65
60
120
2.80
3.36
3.68
3.92
4.10
4.24
4.36
4.47
4.56
120
2.77
3.31
3.63
3.86
4.03
4.17
4.29
4.39
4.47
D2
2
3
4
5
6
7
8
9
10
D2
D,
O all the populations
O populations 2 and 3
O populations 1 and 2 and populations 2 and 3
O populations 1 and 3
(1)
populations 1 and 2 and populations 1 and 3 O populations 1 and 3 and populations 2 and 3
O populations 1 and 2
O none of the populations
Transcribed Image Text:Sample 1
10
2.
The conclusion of a one-way ANOoVA procedure for the data shown in the table is to reject the null hypothesis that the
Sample 2
means are all equal. Determine which means are different using a = 0.05.
Sample 3
18
14
7
20
19
18
20
16
23
Click here to view the ANOVA summary table.
Click here to view a table of critical values for the studentized range.?
Let x, X2, and x, be the means for samples 1, 2, and 3, respectively. Find the absolute values of the differences between the means.
(Simplify your answer. Type an integer or a decimal. Do not round.)
(Simplify your answer. Type an integer or a decimal. Do not round.)
(Simplify your answer. Type an integer or a decimal. Do not round.)
Find the Tukey-Kramer critical range CR. Note that since the samples are all the same size, CR, 2= CR,3= CR23 = CR.
CR =
(Round to two decimal places as needed.)
Conclude that the means for (1)
are different.
1: ANOVA Summary Table
Degrees of Mean Sum of
Squares
Sum of
Source
Squares
Freedom
Between
271.5
2
135.75
17.269
Within
70.75
9
7.861
Total
342 25
11
Expert Solution
This question has been solved!
Explore an expertly crafted, step-by-step solution for a thorough understanding of key concepts.

Step by step
Solved in 3 steps with 1 images

Recommended textbooks for you
MATLAB: An Introduction with Applications
Statistics
ISBN:
9781119256830
Author:
Amos Gilat
Publisher:
John Wiley & Sons Inc

Probability and Statistics for Engineering and th…
Statistics
ISBN:
9781305251809
Author:
Jay L. Devore
Publisher:
Cengage Learning

Statistics for The Behavioral Sciences (MindTap C…
Statistics
ISBN:
9781305504912
Author:
Frederick J Gravetter, Larry B. Wallnau
Publisher:
Cengage Learning
MATLAB: An Introduction with Applications
Statistics
ISBN:
9781119256830
Author:
Amos Gilat
Publisher:
John Wiley & Sons Inc
Probability and Statistics for Engineering and th…
Statistics
ISBN:
9781305251809
Author:
Jay L. Devore
Publisher:
Cengage Learning
Statistics for The Behavioral Sciences (MindTap C…
Statistics
ISBN:
9781305504912
Author:
Frederick J Gravetter, Larry B. Wallnau
Publisher:
Cengage Learning

Elementary Statistics: Picturing the World (7th E…
Statistics
ISBN:
9780134683416
Author:
Ron Larson, Betsy Farber
Publisher:
PEARSON

The Basic Practice of Statistics
Statistics
ISBN:
9781319042578
Author:
David S. Moore, William I. Notz, Michael A. Fligner
Publisher:
W. H. Freeman

Introduction to the Practice of Statistics
Statistics
ISBN:
9781319013387
Author:
David S. Moore, George P. McCabe, Bruce A. Craig
Publisher:
W. H. Freeman