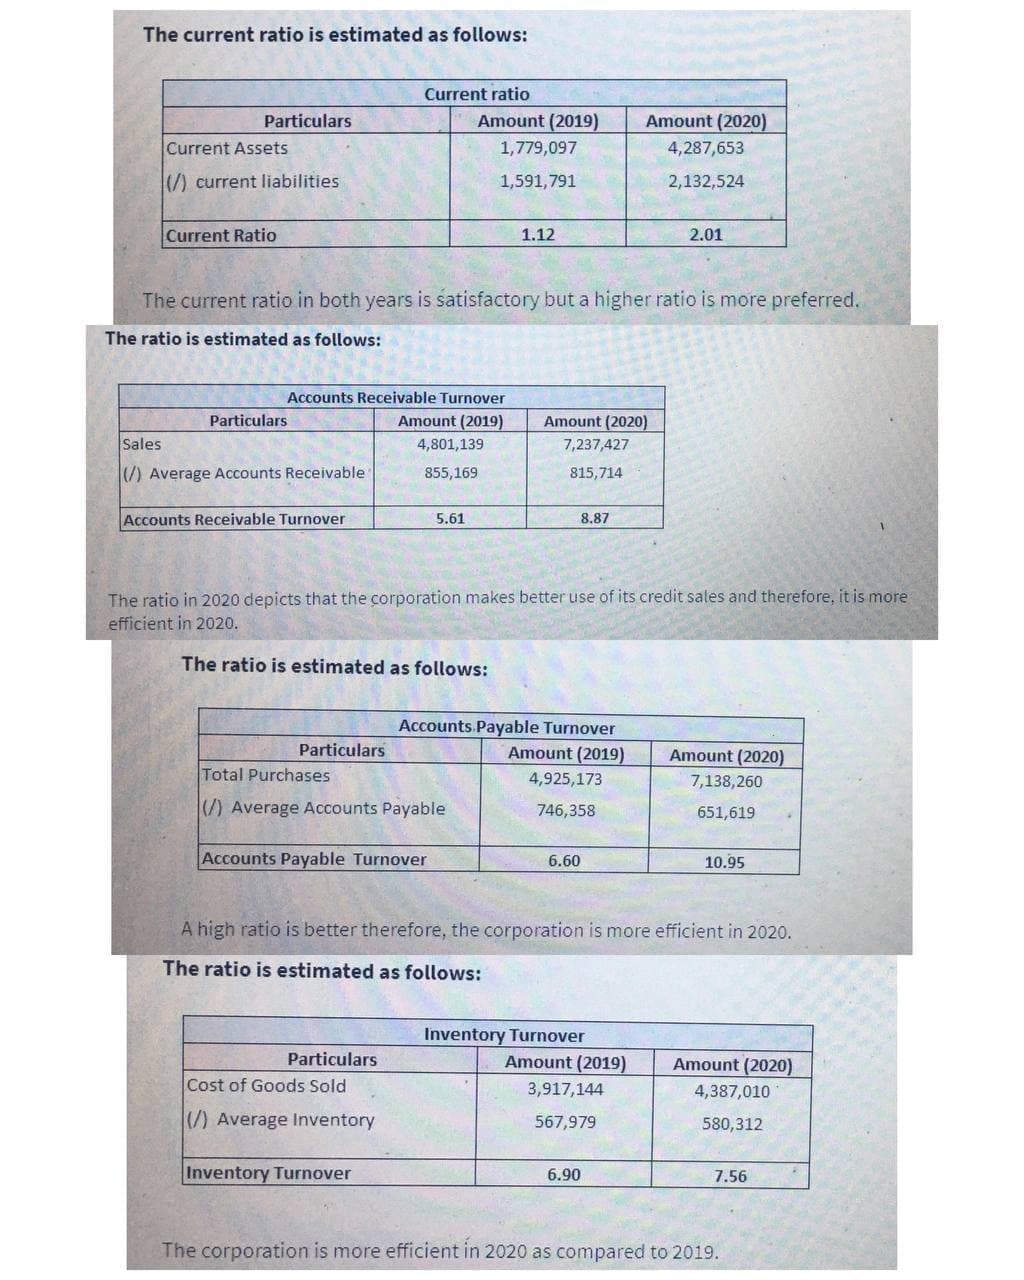
The current ratio is estimated as follows: Current ratio Particulars Amount (2019) Amount (2020) Current Assets 1,779,097 4,287,653 (/) current liabilities 1,591,791 2,132,524 Current Ratio 1.12 2.01 The current ratio in both years is satisfactory but a higher ratio is more preferred. The ratio is estimated as follows: Accounts Receivable Turnover Particulars Amount (2019) Amount (2020) Sales 4,801,139 7,237,427 (/) Average Accounts Receivable 855,169 815,714 Accounts Receivable Turnover 5.61 8.87 The ratio in 2020 depicts that the corporation makes better use of its credit sales and therefore, it is more efficient in 2020. The ratio is estimated as follows: Accounts Payable Turnover Particulars Amount (2019) Amount (2020) Total Purchases 4,925,173 7,138,260 (/) Average Accounts Payable 746,358 651,619 Accounts Payable Turnover 6.60 10.95 A high ratio is better therefore, the corporation is more efficient in 2020. The ratio is estimated as follows: Inventory Turnover Amount (2019) Particulars Amount (2020) Cost of Goods Sold 3,917,144 4,387,010 (/) Average Inventory 567,979 580,312 Inventory Turnover 6.90 7.56 The corporation is more efficient in 2020 as compared to 2019.
The current ratio is estimated as follows: Current ratio Particulars Amount (2019) Amount (2020) Current Assets 1,779,097 4,287,653 (/) current liabilities 1,591,791 2,132,524 Current Ratio 1.12 2.01 The current ratio in both years is satisfactory but a higher ratio is more preferred. The ratio is estimated as follows: Accounts Receivable Turnover Particulars Amount (2019) Amount (2020) Sales 4,801,139 7,237,427 (/) Average Accounts Receivable 855,169 815,714 Accounts Receivable Turnover 5.61 8.87 The ratio in 2020 depicts that the corporation makes better use of its credit sales and therefore, it is more efficient in 2020. The ratio is estimated as follows: Accounts Payable Turnover Particulars Amount (2019) Amount (2020) Total Purchases 4,925,173 7,138,260 (/) Average Accounts Payable 746,358 651,619 Accounts Payable Turnover 6.60 10.95 A high ratio is better therefore, the corporation is more efficient in 2020. The ratio is estimated as follows: Inventory Turnover Amount (2019) Particulars Amount (2020) Cost of Goods Sold 3,917,144 4,387,010 (/) Average Inventory 567,979 580,312 Inventory Turnover 6.90 7.56 The corporation is more efficient in 2020 as compared to 2019.
Chapter9: Accounting For Receivables
Section: Chapter Questions
Problem 10PA: Elegant Universal uses the balance sheet aging method to account for uncollectible debt on...
Related questions
Question
Critically evaluate the ratios calculated below, and comment on your analysis.

Transcribed Image Text:The current ratio is estimated as follows:
Current ratio
Particulars
Amount (2019)
Amount (2020)
Current Assets
1,779,097
4,287,653
(/) current liabilities
1,591, 791
2,132,524
Current Ratio
1.12
2.01
The current ratio in both years is satisfactory but a higher ratio is more preferred.
The ratio is estimated as follows:
Accounts Receivable Turnover
Particulars
Amount (2019)
Amount (2020)
Sales
4,801,139
7,237,427
(/) Average Accounts Receivable
855,169
815,714
Accounts Receivable Turnover
5.61
8.87
The ratio in 2020 depicts that the corporation makes better use of its credit sales and therefore, it is more
efficient in 2020.
The ratio is estimated as follows:
Accounts Payable Turnover
Particulars
Amount (2019)
Amount (2020)
Total Purchases
4,925,173
7,138,260
(/) Average Accounts Payable
746,358
651,619
Accounts Payable Turnover
6.60
10.95
A high ratio is better therefore, the corporation is more efficient in 2020.
The ratio is estimated as follows:
Inventory Turnover
Particulars
Amount (2019)
Amount (2020)
Cost of Goods Sold
3,917,144
4,387,010
(/) Average Inventory
567,979
580,312
Inventory Turnover
6.90
7.56
The corporation is more efficient in 2020 as compared to 2019.

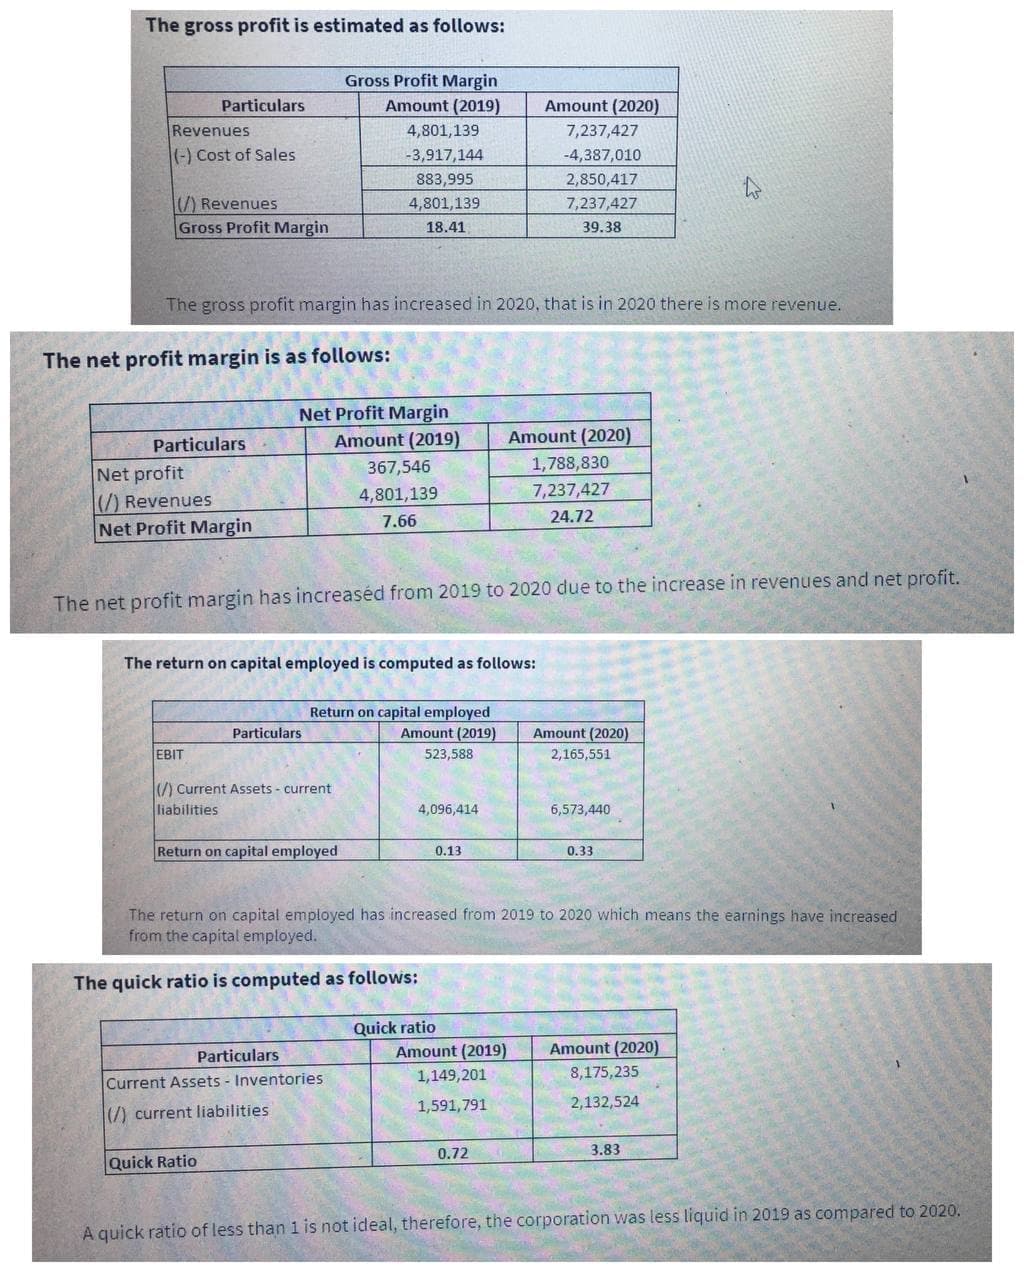
Transcribed Image Text:The gross profit is estimated as follows:
Gross Profit Margin
Particulars
Amount (2019)
Amount (2020)
Revenues
4,801,139
7,237,427
(-) Cost of Sales
-3,917,144
-4,387,010
883,995
2,850,417
(/) Revenues
Gross Profit Margin
4,801,139
7,237,427
18.41
39.38
The gross profit margin has increased in 2020, that is in 2020 there is more revenue.
The net profit margin is as follows:
Net Profit Margin
Particulars
Amount (2019)
Amount (2020)
367,546
1,788,830
Net profit
(/) Revenues
Net Profit Margin
4,801,139
7,237,427
7.66
24.72
The net profit margin has increaséd from 2019 to 2020 due to the increase in revenues and net profit.
The return on capital employed is computed as follows:
Return on capital employed
Amount (2019)
Particulars
Amount (2020)
EBIT
523,588
2,165,551
(/) Current Assets - current
liabilities
4,096,414
6,573,440
Return on capital employed
0.13
0.33
The return on capital employed has increased from 2019 to 2020 which means the earnings have increased
from the capital employed.
The quick ratio is computed as follows:
Quick ratio
Particulars
Amount (2019)
Amount (2020)
1,149,201
8,175,235
Current Assets - Inventories
1,591,791
2,132,524
(7) current liabilities
0.72
3.83
Quick Ratio
A quick ratio of less than 1 is not ideal, therefore, the corporation was less liquid in 2019 as compared to 2020.
Expert Solution
This question has been solved!
Explore an expertly crafted, step-by-step solution for a thorough understanding of key concepts.
Step by step
Solved in 2 steps

Knowledge Booster
Learn more about
Need a deep-dive on the concept behind this application? Look no further. Learn more about this topic, finance and related others by exploring similar questions and additional content below.Recommended textbooks for you

Principles of Accounting Volume 1
Accounting
ISBN:
9781947172685
Author:
OpenStax
Publisher:
OpenStax College

Cornerstones of Financial Accounting
Accounting
ISBN:
9781337690881
Author:
Jay Rich, Jeff Jones
Publisher:
Cengage Learning

Intermediate Financial Management (MindTap Course…
Finance
ISBN:
9781337395083
Author:
Eugene F. Brigham, Phillip R. Daves
Publisher:
Cengage Learning

Principles of Accounting Volume 1
Accounting
ISBN:
9781947172685
Author:
OpenStax
Publisher:
OpenStax College

Cornerstones of Financial Accounting
Accounting
ISBN:
9781337690881
Author:
Jay Rich, Jeff Jones
Publisher:
Cengage Learning

Intermediate Financial Management (MindTap Course…
Finance
ISBN:
9781337395083
Author:
Eugene F. Brigham, Phillip R. Daves
Publisher:
Cengage Learning