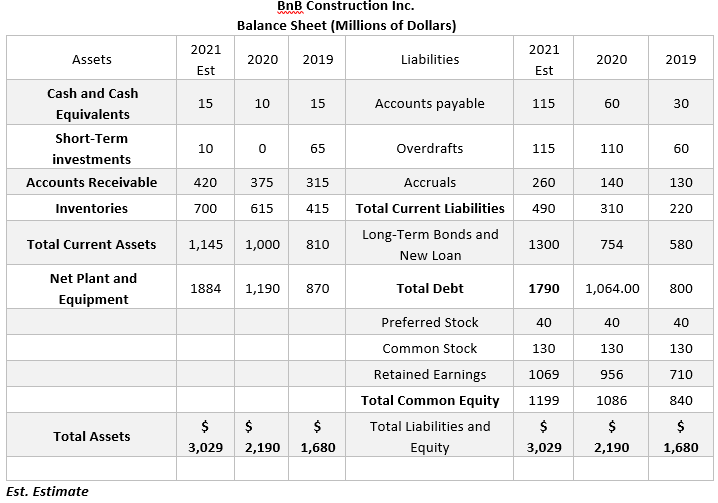
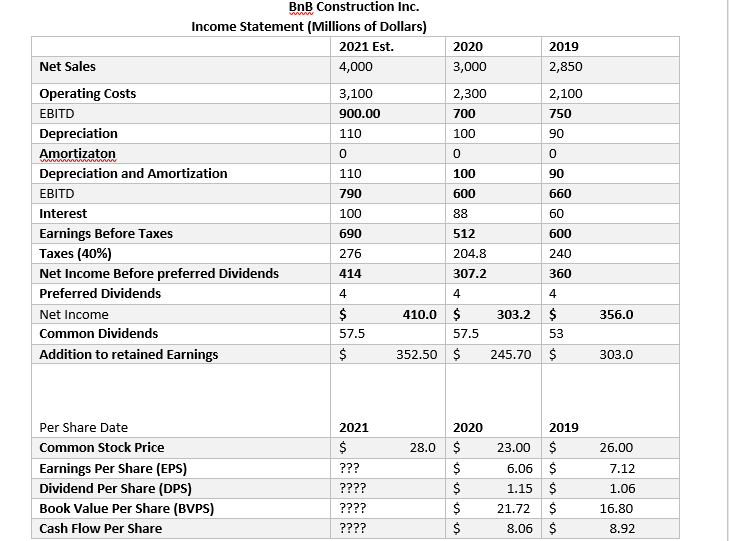
Using the attached balanced sheet and income statement Calculate the following ratios for the respective years: 2019, 2020, 2021 est Liquidity Ratios Current Ratio (times) Quick Ratio (times) Asset Management Ratios Average sales/day Inventory Turnover Ratio (times) Days Sales Outstanding (days) Fixed Assets Turnover Ratio (times) Total Asset Turnover Ratio Debt Management Ratios Total Debt to Total Assets (%) Times Interest Earned (times) Debt to Equity Ratio (%)


Using the attached balanced sheet and income statement
Calculate the following ratios for the respective years: 2019, 2020, 2021 est
|
|
|
|
|
Quick Ratio (times) |
|
|
|
Asset Management Ratios |
|
Average sales/day |
|
Inventory Turnover Ratio (times) |
|
Days Sales Outstanding (days) |
|
Fixed Assets Turnover Ratio (times) |
|
Total Asset Turnover Ratio |
|
|
|
Debt Management Ratios |
|
Total Debt to Total Assets (%) |
|
Times Interest Earned (times) |
|
Debt to Equity Ratio (%) |
|
|
|
Profitability Ratios |
|
Profit Margin on Sales (%) |
|
Earning Power (%) |
|
Return on Total Assets (%) |
|
Return on Common Equity (%) |
|
|
|
Market Value Ratios Price/Earnings Ratio |
|
Price/Earnings Ratio (times) |
|
Price/Cash Flow Ratio (times) |
|
Market /Book Value Ratio (times) |
Comment on the liquidity, profitability, leverage, asset management and market value


Trending now
This is a popular solution!

Step by step
Solved in 2 steps with 2 images


