The data in the table is from the BC Ferries website and shows the sailing time delays for the ferry to Bowen Island on one day. a. For each of the following two variables, name three different statistical graphs that would be appropriate for displaying the distribution of the variable (six different graphs in total). Horseshoe Bay to Snug Cove (Bowen sland) Salling time: 20 minutes Ccheduled Departure Actual Departure Minutes Delayed Reason for Delay 6:05am 6:06am 3. None given 7:05am 7:08am None given 8:0Sam 8:08am None given i. Minutes Delayed (1.5 marks) 9:05am 9:18am 13 Operational Operational i. Reason for Delay (1.5 marks) 10:05am 10:25am 20 11:05am 11:24am 19 Operational b. Clearly show the details of how you calculate by hand the third quartile of number of minutes delayed using each of the two methods (Text and TI) as discussed in this course. Clearly identify each method in your answer. (2 marks) 12:05pm 12:33pm 28 Traffic 2:35pm 2:35pm On Time 3:35pm 3:35pm On Time 4:35pm 4:40pm None given 5:35om 5:43pm None given C. Use your of delay times. (2 marks) calculator to find the mean and standard deviation for this sample d. It would NOT be appropriate to use this sample of 11 delay times to calculate a 95% CI for the mean delay time for the ferry to Bowen Island, because three of the four conditions needed for this confidence interval are clearly not satisfied for this data set. Identify the three conditions that fail, and briefly explain why each particular condition fails. (3 marks)
The data in the table is from the BC Ferries website and shows the sailing time delays for the ferry to Bowen Island on one day. a. For each of the following two variables, name three different statistical graphs that would be appropriate for displaying the distribution of the variable (six different graphs in total). Horseshoe Bay to Snug Cove (Bowen sland) Salling time: 20 minutes Ccheduled Departure Actual Departure Minutes Delayed Reason for Delay 6:05am 6:06am 3. None given 7:05am 7:08am None given 8:0Sam 8:08am None given i. Minutes Delayed (1.5 marks) 9:05am 9:18am 13 Operational Operational i. Reason for Delay (1.5 marks) 10:05am 10:25am 20 11:05am 11:24am 19 Operational b. Clearly show the details of how you calculate by hand the third quartile of number of minutes delayed using each of the two methods (Text and TI) as discussed in this course. Clearly identify each method in your answer. (2 marks) 12:05pm 12:33pm 28 Traffic 2:35pm 2:35pm On Time 3:35pm 3:35pm On Time 4:35pm 4:40pm None given 5:35om 5:43pm None given C. Use your of delay times. (2 marks) calculator to find the mean and standard deviation for this sample d. It would NOT be appropriate to use this sample of 11 delay times to calculate a 95% CI for the mean delay time for the ferry to Bowen Island, because three of the four conditions needed for this confidence interval are clearly not satisfied for this data set. Identify the three conditions that fail, and briefly explain why each particular condition fails. (3 marks)

Chapter3: Polynomial Functions
Section3.5: Mathematical Modeling And Variation
Problem 72E

Related questions
Question
Transcribed Image Text:STAT 1201 PRACTICE EXAMINATION
5 OF 17
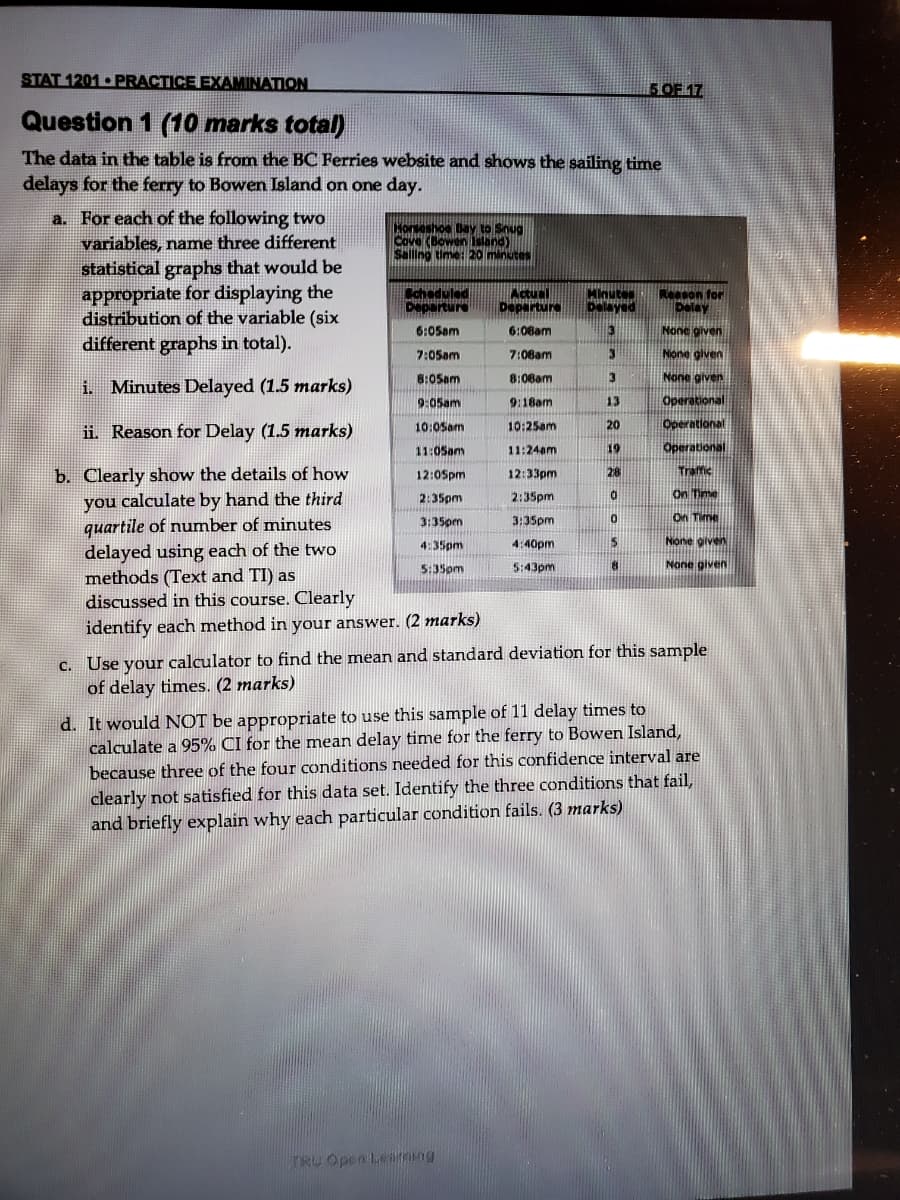
Question 1 (10 marks total)
The data in the table is from the BC Ferries website and shows the sailing time
delays for the ferry to Bowen Island on one day.
a. For each of the following two
variables, name three different
statistical graphs that would be
appropriate for displaying the
distribution of the variable (six
different graphs in total).
Horseshoe Bay to Snug
Cove (Bowen sland)
Salling time: 20 minutes
Scheduled
Departure
Actual
Departure
Minutes
Delayed
Reeson for
Delay
6:05am
6:06am
None given
7:05am
7:08am
Nione given
8:05am
8:08am
None given
i. Minutes Delayed (1.5 marks)
9:05am
9:18am
13
20
ii. Reason for Delay (1.5 marks)
10:0Sam
10:25am
11:05am
11:24am
19
b. Clearly show the details of how
you calculate by hand the third
quartile of number of minutes
12:0Spm
12:33pm
28
Traffic
2:35pm
2:35pm
On Time
3:35pm
3:35pm
On Time
None given
delayed using each of the two
methods (Text and TI) as
discussed in this course. Clearly
4:35pm
4:40pm
5:35om
5:43pm
None given
identify each method in your answer. (2 marks)
c. Use your calculator to find the mean and standard deviation for this sample
of delay times. (2 marks)
d. It would NOT be appropriate to use this sample of 11 delay times to
calculate a 95% CI for the mean delay time for the ferry to Bowen Island,
because three of the four conditions needed for this confidence interval are
clearly not satisfied for this data set. Identify the three conditions that fail,
and briefly explain why each particular condition fails. (3 marks)
TRU Open Learoing
Expert Solution
This question has been solved!
Explore an expertly crafted, step-by-step solution for a thorough understanding of key concepts.

Step by step
Solved in 2 steps with 2 images

Recommended textbooks for you

Trigonometry (MindTap Course List)
Trigonometry
ISBN:
9781337278461
Author:
Ron Larson
Publisher:
Cengage Learning

Glencoe Algebra 1, Student Edition, 9780079039897…
Algebra
ISBN:
9780079039897
Author:
Carter
Publisher:
McGraw Hill
Trigonometry (MindTap Course List)
Trigonometry
ISBN:
9781337278461
Author:
Ron Larson
Publisher:
Cengage Learning
Glencoe Algebra 1, Student Edition, 9780079039897…
Algebra
ISBN:
9780079039897
Author:
Carter
Publisher:
McGraw Hill

Algebra & Trigonometry with Analytic Geometry
Algebra
ISBN:
9781133382119
Author:
Swokowski
Publisher:
Cengage