The data provided list a sample of the time in seconds to process customers at a ticket counter A frequency distribution and histogram of the data are also provided Complete parts a through c. Click here to view the data Click here to view a frequency distribution and histogram of the data - X O Frequency Distribution and Histogram a. Summarize the data using the Descriptive Statistics tool. What can you say about the shape of the distribution of times? (Type integers or decimals rounded to two decimal places as needed) Mean Bin Frequency Standard Error Histogram Median 50 8. Mode 100 Standard Deviation 150 9. Sample Variance 200 4. 10 250 1 Kurtosis 300 1 Skewness 350 Range 400 Minimum 450 Maximum 500 Sum 550 Count 600 More 0 50 100 150 250 300 350 400 450 500 550 600 More Frequency
The data provided list a sample of the time in seconds to process customers at a ticket counter A frequency distribution and histogram of the data are also provided Complete parts a through c. Click here to view the data Click here to view a frequency distribution and histogram of the data - X O Frequency Distribution and Histogram a. Summarize the data using the Descriptive Statistics tool. What can you say about the shape of the distribution of times? (Type integers or decimals rounded to two decimal places as needed) Mean Bin Frequency Standard Error Histogram Median 50 8. Mode 100 Standard Deviation 150 9. Sample Variance 200 4. 10 250 1 Kurtosis 300 1 Skewness 350 Range 400 Minimum 450 Maximum 500 Sum 550 Count 600 More 0 50 100 150 250 300 350 400 450 500 550 600 More Frequency

Big Ideas Math A Bridge To Success Algebra 1: Student Edition 2015
1st Edition
ISBN:9781680331141
Author:HOUGHTON MIFFLIN HARCOURT
Publisher:HOUGHTON MIFFLIN HARCOURT
Chapter11: Data Analysis And Displays
Section: Chapter Questions
Problem 11CR

Related questions

Concept explainers
Equations and Inequations
Equations and inequalities describe the relationship between two mathematical expressions.
Linear Functions
A linear function can just be a constant, or it can be the constant multiplied with the variable like x or y. If the variables are of the form, x2, x1/2 or y2 it is not linear. The exponent over the variables should always be 1.
Question
4_9 see pictures to solve
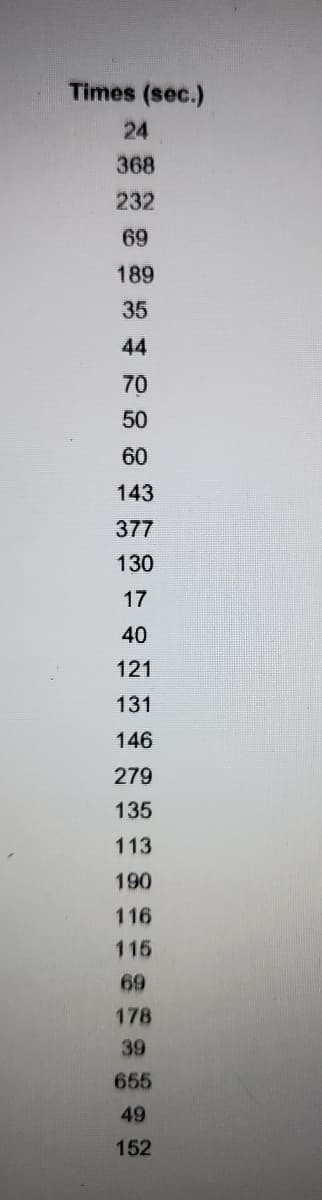
Transcribed Image Text:Times (sec.)
24
368
232
69
189
35
44
70
50
60
143
377
130
17
40
121
131
146
279
135
113
190
116
115
69
178
39
655
49
152
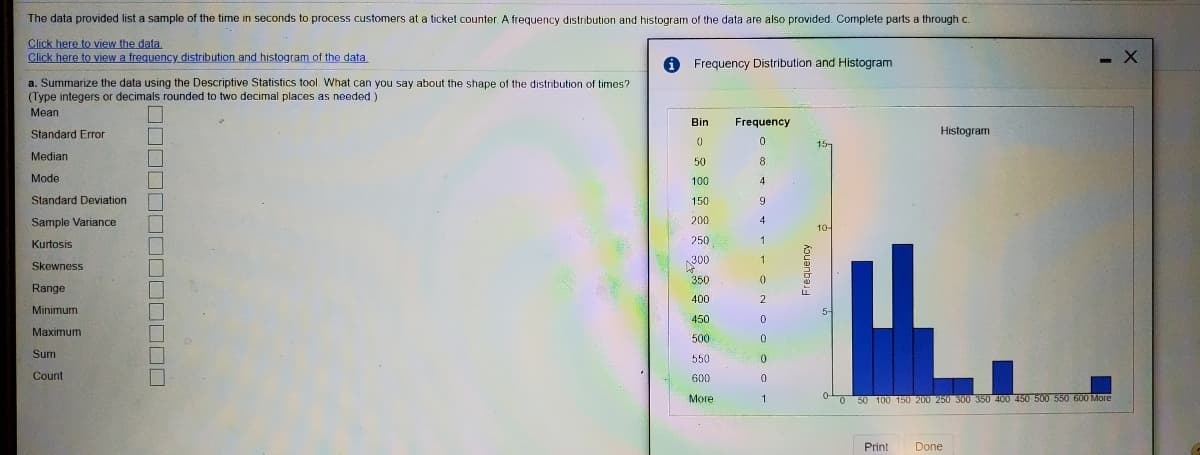
Transcribed Image Text:The data provided list a sample of the time in seconds to process customers at a ticket counter. A frequency distribution and histogram of the data are also provided. Complete parts a through c.
Click here to view the data
Click here to view a frequency distribution and histogram of the data
Frequency Distribution and Histogram
a. Summarize the data using the Descriptive Statistics tool. What can you say about the shape of the distribution of times?
(Type integers or decimals rounded to two decimal places as needed )
Mean
Bin
Frequency
Standard Error
Histogram
Median
50
Mode
100
寸
Standard Deviation
150
Sample Variance
200
4.
10-
250
1
Kurtosis
4.
Skewness
300
1
350
Range
400
2
Minimum
450
Maximum
500
Sum
550
Count
600
More
0 50 100 150 200 250 300 350 400 450 500 550 600 More
Print
Done
DOOOD0
Frequency
Expert Solution
This question has been solved!
Explore an expertly crafted, step-by-step solution for a thorough understanding of key concepts.

This is a popular solution!

Trending now
This is a popular solution!

Step by step
Solved in 2 steps with 2 images

Knowledge Booster


Learn more about
Need a deep-dive on the concept behind this application? Look no further. Learn more about this topic, statistics and related others by exploring similar questions and additional content below.Recommended textbooks for you
Big Ideas Math A Bridge To Success Algebra 1: Stu…
Algebra
ISBN:
9781680331141
Author:
HOUGHTON MIFFLIN HARCOURT
Publisher:
Houghton Mifflin Harcourt

Glencoe Algebra 1, Student Edition, 9780079039897…
Algebra
ISBN:
9780079039897
Author:
Carter
Publisher:
McGraw Hill
Big Ideas Math A Bridge To Success Algebra 1: Stu…
Algebra
ISBN:
9781680331141
Author:
HOUGHTON MIFFLIN HARCOURT
Publisher:
Houghton Mifflin Harcourt
Glencoe Algebra 1, Student Edition, 9780079039897…
Algebra
ISBN:
9780079039897
Author:
Carter
Publisher:
McGraw Hill