The display provided from technology available below results from using data for a smartphone carrier's data speeds at airports to test the claim that they are from a population having a mean less than 4.00 Mbps. Conduct the hypothesis test using these results. Use a 0.05 significance level. Identify the null and alternative hypotheses, test statistic, P-value, and state the final conclusion that addresses the original claim. A Click the icon to view the display from technology.
The display provided from technology available below results from using data for a smartphone carrier's data speeds at airports to test the claim that they are from a population having a mean less than 4.00 Mbps. Conduct the hypothesis test using these results. Use a 0.05 significance level. Identify the null and alternative hypotheses, test statistic, P-value, and state the final conclusion that addresses the original claim. A Click the icon to view the display from technology.

Glencoe Algebra 1, Student Edition, 9780079039897, 0079039898, 2018
18th Edition
ISBN:9780079039897
Author:Carter
Publisher:Carter
Chapter10: Statistics
Section10.3: Measures Of Spread
Problem 1GP

Related questions
Topic Video
Question
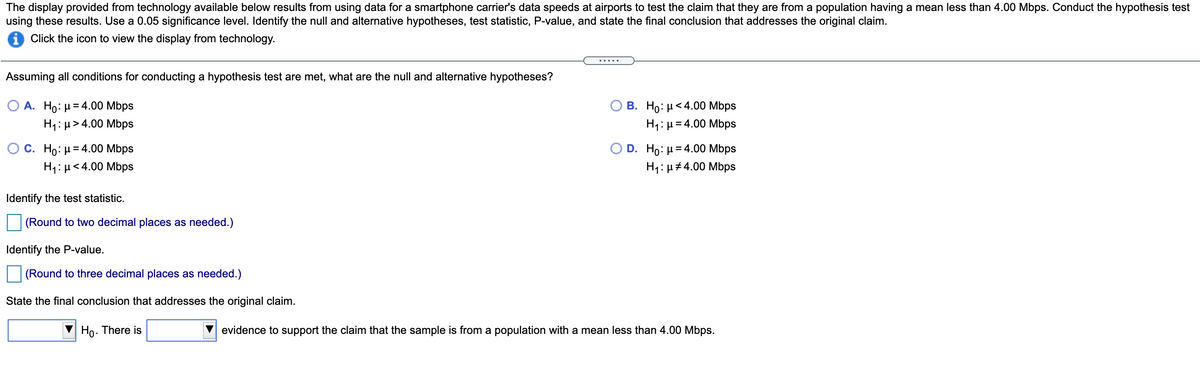
Transcribed Image Text:The display provided from technology available below results from using data for a smartphone carrier's data speeds at airports to test the claim that they are from a population having a mean less than 4.00 Mbps. Conduct the hypothesis test
using these results. Use a 0.05 significance level. Identify the null and alternative hypotheses, test statistic, P-value, and state the final conclusion that addresses the original claim.
i Click the icon to view the display from technology.
.....
Assuming all conditions for conducting a hypothesis test are met, what are the null and alternative hypotheses?
Ο Α. H0 μ= 4.00 Mbps
H1: µ> 4.00 Mbps
B. Ho: µ<4.00 Mbps
H4: µ = 4.00 Mbps
O D . Ho: μ= 4.00 Mbps
H1: µ#4.00 Mbps
O C. Ho: µ= 4.00 Mbps
H1: µ<4.00 Mbps
Identify the test statistic.
(Round to two decimal places as needed.)
Identify the P-value.
(Round to three decimal places as needed.)
State the final conclusion that addresses the original claim.
Ho. There is
evidence to support the claim that the sample is from a population with a mean less than 4.00 Mbps.
Expert Solution
This question has been solved!
Explore an expertly crafted, step-by-step solution for a thorough understanding of key concepts.

This is a popular solution!

Trending now
This is a popular solution!

Step by step
Solved in 2 steps with 1 images

Knowledge Booster


Learn more about
Need a deep-dive on the concept behind this application? Look no further. Learn more about this topic, statistics and related others by exploring similar questions and additional content below.Recommended textbooks for you
Glencoe Algebra 1, Student Edition, 9780079039897…
Algebra
ISBN:
9780079039897
Author:
Carter
Publisher:
McGraw Hill
Glencoe Algebra 1, Student Edition, 9780079039897…
Algebra
ISBN:
9780079039897
Author:
Carter
Publisher:
McGraw Hill