The figure below shows the one-line diagram of a simple three-bus power system with generation at bus 1. The voltage at bus 1 is V1 = 1.020°per unit. The scheduled loads on buses 2 and 3 are marked on the diagram. Line impedances are marked in per unit on a 100 MVA base. (a) Using Gauss-Seidel method and initial estimates of V, = 1.0 + j0, V,0) = 1.0 + j0, determine V2 (0)- and V3. Perform two iterations. (b) If after several iterations the bus voltages converge to V2 = 0.90 – j0.10 pu V3 = 0.95 – j0.05 pu determine the line flows and line losses and the slack bus real and reactive power. V = 120°! it 400 MW + 320 Mvar Slack j0.0125 30.05 3 300 MW 270 Mvar


Load flow analysis
Load flow analysis is a study or numerical calculation of the power flow of power in steady-state conditions in any electrical system. It is used to determine the flow of power (real and reactive), voltage, or current in a system under any load conditions.
Nodal Matrix
The nodal matrix or simply known as admittance matrix, generally in engineering term it is called Y Matrix or Y bus, since it involve matrices so it is also referred as a n into n order matrix that represents a power system with n number of buses. It shows the buses' nodal admittance in a power system. The Y matrix is rather sparse in actual systems with thousands of buses. In the power system the transmission cables connect each bus to only a few other buses. Also the important data that one needs for have a power flow study is the Y Matrix.
Types of Buses
A bus is a type of system of communication that transfers data between the components inside a computer or between two or more computers. With multiple hardware connections, the earlier buses were parallel electrical wires but the term "bus" is now used for any type of physical arrangement which provides the same type of logical functions similar to the parallel electrical bus. Both parallel and bit connections are used by modern buses. They can be wired either electrical parallel or daisy chain topology or are connected by hubs which are switched same as in the case of Universal Serial Bus or USB.
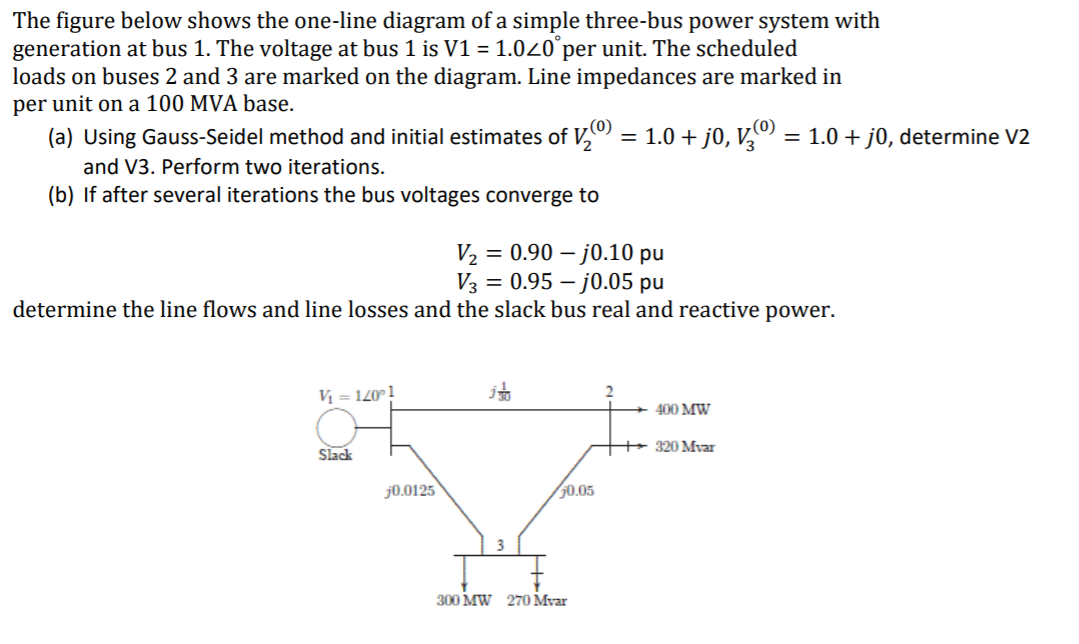
The figure below shows the one-line diagram of a simple three-bus power system with
generation at bus 1. The voltage at bus 1 is V1 = 1.0∠0
°per unit. The scheduled
loads on buses 2 and 3 are marked on the diagram. Line impedances are marked in
per unit on a 100 MVA base.
(a) Using Gauss-Seidel method and initial estimates of ?2
(0) = 1.0 + ?0, ?3
(0) = 1.0 + ?0, determine V2
and V3. Perform two iterations.
(b) If after several iterations the bus voltages converge to
?2 = 0.90 − ?0.10 pu
?3 = 0.95 − ?0.05 pu
determine the line flows and line losses and the slack bus real and reactive power.


Trending now
This is a popular solution!

Step by step
Solved in 3 steps with 3 images


