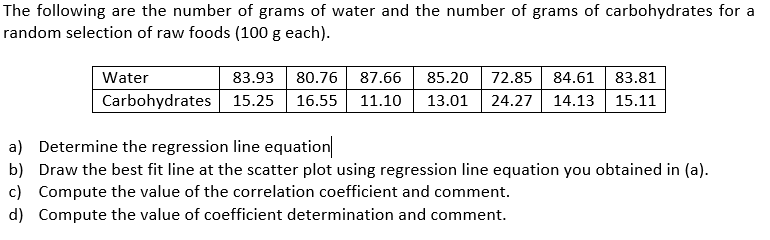
The following are the number of grams of water and the number of grams of carbohydrates for a random selection of raw foods (100 g each). Water 83.93 80.76 87.66 85.20 72.85 84.61 83.81 Carbohydrates 15.25 16.55 11.10 13.01 24.27 14.13 15.11 a) Determine the regression line equation b) Draw the best fit line at the scatter plot using regression line equation you obtained in (a). c) Compute the value of the correlation coefficient and comment. d) Compute the value of coefficient determination and comment.


Q: he following data shows the dexterity test scores of five assembly-line employees of Dimples Company…
A: Since you have asked multiple questions, we will solve the first question for you. If you want any…
Q: The following scores were collected by a researcher: Participants Y 8. 12 7. 14 17 3. 18 21 23 6. 1.…
A: Note: " Since you have asked multiple sub-parts, we will solve the first three sub-parts for you. If…
Q: study was done to look at the relationship between number of movies people watch at the theater each…
A: Since you have posted questions with multiple subparts, we will solve the first three subparts for…
Q: Consider the following data generating process, Yt = Bo + B1*t + Et, where y and x are variables and…
A:
Q: 6. Consider the following set of data points: 2 4 14 20 23 25 Y 2 6 14 20 12 19 Construct a scatter…
A: Scatter plot is the graphical representation of the relationship between two variables of a…
Q: The following data on r = the line speed (feet per minute) and y = the number of defective parts…
A: Given data and required calculation is shown below
Q: 4.For a sample of 12 observations, a businessman wants to regress the price (in dollar) of the…
A:
Q: For a sample of 8 employees, a personnel director has collected the following data on ownership of…
A: As per our guidelines we can solve first three subpart and rest can be reposted. Solution-: X=Years…
Q: The following data on price ($) and the overall score for 6 stereo headphones that were tested by…
A: For the given data find all the required blanks
Q: a) What kind of relationship exist between the exam scores and the clas sizes? Interpret the…
A: The regression line is given by score = 95 -1.2Size There is a negative relationship between the…
Q: Given the following Anova output of a regression output from MS Excel Source DF SS MS F…
A: Solution: k=4 independent variables n= 25 observation The ANOVA table is Source DF SS MS F…
Q: What is the equation of the regression line?
A: Answer:
Q: Consider the following dataset obtained from a sample. 13 y 1 21 3 24 2 16 7 29 18 8 33 15 6 29 7 13…
A: The multiple linear regression is used when there are more than 1 explanatory variables. The…
Q: Which of the following method should she use to answer her question of interest?
A:
Q: Given are five observations for two variables, x and y. 2 4 5 4 12 14 The estimated regression…
A: a. Consider that x is the independent variable and y is the dependent variable. The size of the…
Q: Given the following sample statistics X(bar) = 20, Y(bar) = 200, Sx = 100, Sy = 60, Rxy = 0.4, n =…
A: Given: x=20, y=200, sx=100, sy=60, rxy=0.4 and n=50. Then,b1=rxysysx=0.460100=0.24
Q: An investigation was carried out on 10 second-hand cars to explore the relationship between the age…
A:
Q: Given the following Anova output of a regression output from MS Excel Source DF SS MS F…
A: Hey, since there are multiple subparts posted, we will answer first three subparts. If you want any…
Q: Given are five observations collected in a regression study on two variables. 2 6 9 13 20 7…
A: Let first variable represents independent variable (x) and second variable (y) represents response…
Q: Consider the following estimated regression with a sample of size n=50. AHE = -2.44 – 1.57 » DFemale…
A: While fitting a linear regression model, one of the most important assumption is the the variance of…
Q: For the data and sample regression equation shown below, do the following. a. Decide, at the 10%…
A: Given: n = 4 Y = -1.5 + 1.1X Formula Used: Test-statistic t = b-βSe Confidence interval = b ± t*se
Q: Consider the following sample of production volumes and total cost data for a manufacturing…
A:
Q: For a sample of 8 employees, a personnel director has collected the following data on ownership of…
A: Given, For a sample of 8 employees, a personnel director has collected the following data on…
Q: Based on the following table, what is the sample regression equation? Standard Coefficients Error t…
A: We have been given the output of regression. We have the regression equation given as,…
Q: Given below are seven observations collected in a regression study on two variables, x (independent…
A: x y 2 12 3 9 6 8 7 7 8 6 7 5 9 2
Q: The following sample observations were randomly selected. (Round intermediate calculations and final…
A: From the provided information, x 3 5 3 7 6 y 2 6 5 7 6
Q: The following data on x = the line speed (feet per minute) and y = the number of defective parts…
A: Obtain the 95% confidence interval for the mean number of defective parts for a line speed of 25…
Q: A statistical program is recommended. Consider the following data for a dependent variable y and two…
A:
Q: Given the following sample statistics X(bar) = 20, Y(bar) = 200, Sx= 100, Sy= 60, Rxy = 0.4, n= 50,…
A:
Q: Consider the following dataset obtained from a sample. 1 80 3 97 4. 92 4 102 103 8 111 10 119 10 123…
A: According to the answering guidelines, we can answer only three subparts of a question and the rest…
Q: In exercise 12, the following data on x = average daily hotel room rate and y = amount spent on…
A: a) Given that the regression equation is, ŷ = 17.49 + 1.0334x. Given that x=89. Substitute 89…
Q: The following data based on 450 students are given for marks in Statistics and Economics at a…
A: The two regression lines are in the form of straight line equations as shown below The equation of…
Q: 10. Below is computer output from the least squares regression analysis on the body mass index, BMI,…
A: Given, BMI Coeff = 1.695 SE Coeff = 0.2280 t = 2.262 at 9 degree of freedom (n-1)1.695
Q: Suppose you are a dolphin trainer at SeaWorld. You teach the dolphins by rewarding them with fish…
A: The answer is attached below,
Q: Use the following information from a multiple regression analysis b, = 3 n= 20 b, = 2 So, = 1.1 S, =…
A:
Q: Given the following sample statistics X(bar) = 20, Y(bar) = 200, Sx = 100, Sy = 60, Rxy = 0.4, n =…
A:
Q: In a simple linear regression, given that the sample variances of x and y Sx^2=510, Sy^2=750…
A: Provided information is ; Sample variance of x=(Sx2 )= 510 , Sx=510 = 22.5832 Sample…
Q: 1) A sample of fast food menu items is taken and the item's sodium and calories are reported. Sodium…
A: a) Sodium(mg) Calories 350 160 970 300 590 290 250 160 635 180 520 240 800 320…
Q: The following is a partial computer output of a multiple regression analysis of a data set…
A: The provided information is: The regression equation is,SALEPRIC = 1470 + 0.814 LANDVAL + 0.820…
Q: Given the following sample statistics X(bar) = 20, Y(bar) = 200, Sx= 100, Sy = 60, RxY = 0.4, n =…
A:
Q: The following data are the monthly salaries and the grade point averages for students who obtained…
A: a. The data related to the monthly salaries (y) and the grade point averages (x) for students, who…
Q: Suppose you have a regression model with 2 independent variables and 85 observations. Considering…
A: Given Information : Number of independent variable, k = 2. Number of observation = 85. Significance…
Q: Consider the following estimated regression with a sample of size n=50: AHE = -2.44 – 1.57 • DFemale…
A: Given: AHE^=-2.44-1.57×DFemale+0.27×DMarried+0.59×Educ+0.04×Exper and the scatter plot
Q: Consider the following set of dependent and independent variables. Use these data to complete parts…
A: Excel Procedure: Enter Y, x1 and x2 data in Excel>Go to Data>Click on Data Analysis>…
Q: Given the following estimated model Ý=12-0.3Xie (4) (3) SSR =700, SSE=100 and n =27e Where in…
A: The independent variable is x and the dependent variable is y. We have to find the coefficient of…
Q: The following are sample data provided by a movingcompany on the weights of six shipments, the…
A: (a) Excel Procedure: Enter the data for y, x1 and x2 in Excel>Data> Data Analysis.>…
Q: The following table lists the monthly incomes (in hundreds of dollars) and the monthly rents paid…
A: Note: Hey, since there are multiple subparts posted, we will answer first three subparts. If you…
Q: The following data on price ($) and the overall score for 6 stereo headphones that were tested by…
A: For the given data FIND a. Does the t test indicate a significant relationship between price and…
Q: Construct a 95% confidence interval for the average value of y for the following data. Use x = 25,…
A: Solution: Given information: The estimated regression equation is y^= 16.920+0.160x Se= 4.77…
Q: c). Find the equation of the sample regression line using Minitab. d). Interpret the meaning of…
A: c) Let x be the price and y be the sales. The regression equation is obtained by using MINITAB:…

Step by step
Solved in 4 steps

- Mr. James, president of Daniel-James Financial Services, believes that there is a relationship between the number of client contacts and the dollar amount of sales. To document this assertion, he gathered the following information from a sample of clients for the last month. Let X represent the number of times that the client was contacted and Y represent the valye of sales ($1000) for each client sampled. Number of Contacts (X) Sales ($1000) 14 24 12 14 20 28 16 30 23 30 a) Compute the regression equation for client contacts and sales. Interpret the slope and intercept parameters.A sociologist was hired by a large city hospital to investigate the relationship between the number of unauthorized days that employees are absent per year and the distance (miles) between home and work for the employee. A sample of 10 employees was chosen, and the following data were collected. A. Is the estimated regression equation appropriate and adequatefind the (a) explained variation, (b) unexplained variation, and (c) indicated prediction interval. In each case, there is sujficient evidence to support a claim of a linear correlation, so it is reasonable to use the regression equation when making predictions. Altitude and Temperature Listed below are altitudes (thousands of feet) and outside air temperatures (°F) recorded by the author during Delta Flight 1053 from New Orleans to Atlanta. For the prediction interval, use a 95% confidence level with the altitude of 6327 ft (or 6.327 thousand feet).
- Using the regression line attached. Based on only the above plot, one can conclude: a) height causes an increase in weight b) weight causes an increase in height c) taller people are more likely to weigh more than shorter people, at least in the sample on which this data is based d) a statistically significant predictive relationship between height and weight e) c and dSuppose the following data were collected from a sample of 15 houses relating selling price to square footage and the architectural style of the house. Use statistical software to find the following regression equation: PRICEi=b0+b1SQFTi+b2COLONIALi+b3RANCHi+ei . Is there enough evidence to support the claim that on average, houses that are ranch style have lower selling prices than houses that are Victorian style at the 0.05 level of significance? If yes, write the regression equation in the spaces provided with answers rounded to two decimal places. Else, select "There is not enough evidence."Selling Price Square Footage Colonial (1 if house is Colonial style, 0 otherwise) Ranch (1 if house is Ranch style, 0 otherwise) Victorian (1 if house is Victorian style, 0 otherwise) 377640 1941 1 0 0 460996 3397 0 1 0 405781 2764 0 0 1 407216 2906 0 0 1 435139 3401 1 0 0 405275 2600 0 0 1 381141 2203 0 1 0 370490 2046 1 0 0 404070 2210 0 0 1 460196 3692 0 1 0 382780 2172 1 0 0 406466 2606 0 1…The owner of Maumee Ford-Mercury-Volvo wants to study the relationship between the age of a car and its selling price. Listed below is a random sample of 12 used cars sold at the dealership during the last year. Car Age Price 1 10 10.8 2 6 9.1 3 12 4.3 4 16 5 5 8 5.1 6 7 11.5 7 9 11.6 8 13 8 9 12 8 10 16 3.9 11 4 12.8 12 4 11.1 Determine the regression equation. (Negative value should be indicated by a minus sign. Round your answers to 3 decimal places.) a= 14.010 b= ? Estimate the selling price of a 9-year-old car (in $000). (Round your answer to 3 decimal places.) So for each additional year, the car price decreases 8.862 in value. Interpret the regression equation (in dollars). (Round your answer to the nearest dollar amount.) For each additional year, the car price decreases $_____ in value.
- The owner of Maumee Ford-Mercury-Volvo wants to study the relationship between the age of a car and its selling price. Listed below is a random sample of 12 used cars sold at the dealership during the last year. Car Age Price 1 10 10.8 2 6 9.1 3 12 4.3 4 16 5 5 8 5.1 6 7 11.5 7 9 11.6 8 13 8 9 12 8 10 16 3.9 11 4 12.8 12 4 11.1 Determine the regression equation. (Negative value should be indicated by a minus sign. Round your answers to 3 decimal places.) a= b= Estimate the selling price of a 9-year-old car (in $000). (Round your answer to 3 decimal places.) So for each additional year, the car price decreases ____ in value. Interpret the regression equation (in dollars). (Round your answer to the nearest dollar amount.)The data from exercise 3 follow. xi 2 6 9 13 20 yi 7 18 9 26 23 The estimated regression equation is = 7.6 + .9x. What is the value of the standard error of the estimate (to 4 decimals)? What is the value of the t test statistic (to 2 decimals)? What is the p-value? Use Table 1 of Appendix B.Selectless than .01between .01 and .02between .02 and .05between .05 and .10between .10 and .20between .20 and .40greater than .40Item 3 What is your conclusion ( = .05)?SelectConclude a significant relationship exists between x and yCannot conclude a significant relationship exists between x and yItem 4 Use the F test to test for a significant relationship. Use = .05.Compute the value of the F test statistic (to 2 decimals). What is the p-value?Selectless than .01between .01 and .025between .025 and .05between .05 and .10greater than .10Item 6 What is your conclusion?SelectConclude a significant relationship exists between x and yCannot conclude a significant relationship exists…Bill is the office manager for a group of financial advisors who provide financial services for individual clients. She would like to investigate whether a relationship exists between the number of presentations made to prospective clients in a month and the number of new clients per month. The following table shows the number of presentations and corresponding new clients for a random sample of six employees. Employee Presentations New Clients 1 2 1 2 8 2 3 9 4 4 10 3 5 11 5 6 12 6 Bill would like to use simple regression analysis to estimate the number of new clients per month based on the number of presentations made by the employee per month. The average number of new clients per month for an employee who made 20 presentations per month is ________. 5.02 5.45 3.43 8.69
- A zoologist selected 12 black bears in a Canadian habitat at random to examine the relationship between the age in years, xx, and the weight in tens of pounds, yy. The 95 percent confidence interval for estimating the population slope of the linear regression line predicting weight in tens of pounds based on the age in years is given by 1.272±0.5701.272±0.570. Assume that the conditions for inference for the slope of the regression equation are met. Which of the following is the correct interpretation of the interval? A)We are 95 percent confident that the mean increase in the weight of a black bear for each one-year increase in the age of the bear is between 7.0 and 18.4 pounds. B)We are 95 percent confident that an increase of one year in the age of an individual black bear will result in an increase in the black bear’s weight of between 7.0 and 18.4 pounds. C)We are 95 percent confident that for every one-year increase in the age of black bears in the sample,…Sarah is the office manager for a group of financial advisors who provide financial services for individual clients. She would like to investigate whether a relationship exists between the number of presentations made to prospective clients in a month and the number of new clients per month. The following table shows the number of presentations and corresponding new clients for a random sample of six employees. Employee Presentations New Clients 1 7 2 2 9 3 3 9 4 4 10 3 5 11 5 6 12 3 Sarah would like to use simple regression analysis to estimate the number of new clients per month based on the number of presentations made by the employee per month. The expected number of new clients per month for an employee who made 10 presentations per month is ________. 2.3982 1.6753 3.0521 3.4348The Wall Street Journal asked Concur Technologies, Inc., an expense management company, to examine data from 8.3 million expense reports to provide insights regarding business travel expenses. Their analysis of the data showed that New York was the most expensive city. The following table shows the average daily hotel room rate (X) and the average amount spent on entertainment (Y) for a random sample of 9 of the 25 most-visited U.S. cities. These data lead to the estimated regression equation y = 17.49 + 1.0334x. For these data SSE = 1541.4. Use Table 1 of Appendix B. a. Predict the amount spent on entertainment for a particular city that has a daily room rate of $89 (to 2 decimals). b. Develop a 95% confidence interval for the mean amount spent on entertainment for all cities that have a daily room rate of $89 (to 2 decimals). c. The average room rate in Chicago is $128. Develop a 95% prediction interval for the amount spent on entertainment in Chicago (to 2 decimals).