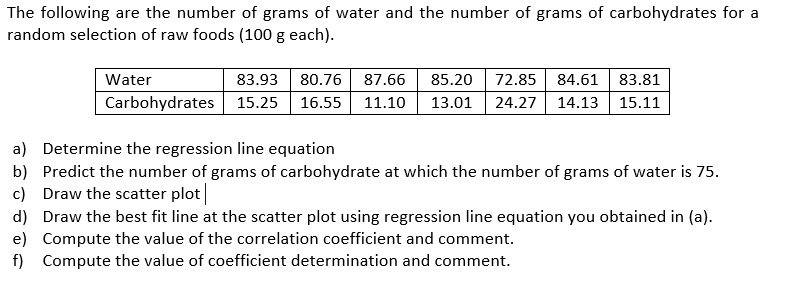
The following are the number of grams of water and the number of grams of carbohydrates for a random selection of raw foods (100 g each). 72.85 84.61| 83.81 24.27 14.13 15.11 Water 83.93 80.76 87.66| 85.20 Carbohydrates 15.25 | 16.55| 11.10 13.01 a) Determine the regression line equation b) Predict the number of grams of carbohydrate at which the number of grams of water is 75. c) Draw the scatter plot


Q: The following scores were collected by a researcher: Participants Y 8. 12 7. 14 17 3. 18 21 23 6. 1.…
A: Note: " Since you have asked multiple sub-parts, we will solve the first three sub-parts for you. If…
Q: study was done to look at the relationship between number of movies people watch at the theater each…
A: Since you have posted questions with multiple subparts, we will solve the first three subparts for…
Q: Years of Work Experience and number of Job Offers of 10 job-seekers were as follows: Work Exp.…
A: from regression y = a + bx y is dependent variable = no of offers a intercept b is slope x…
Q: 6. Consider the following set of data points: 2 4 14 20 23 25 Y 2 6 14 20 12 19 Construct a scatter…
A: Scatter plot is the graphical representation of the relationship between two variables of a…
Q: 4.For a sample of 12 observations, a businessman wants to regress the price (in dollar) of the…
A:
Q: For a sample of 8 employees, a personnel director has collected the following data on ownership of…
A:
Q: The following data, based on 450 students, are given for marks in Statistics and Economics at a…
A: Let X be the marks in Statistics Y be the marks in economics.
Q: Following is information on the price per share and the dividend for a sample of 30 companies. Price…
A: The independent variable is Dividend. The dependent variable is Price. We have to test the…
Q: Use the Durbin-Watson test to test, at 5% level of significance, for the presence of significant…
A: Null Hypothesis: H0: There is no significant linear correlation among the error terms. Alternative…
Q: a) What kind of relationship exist between the exam scores and the clas sizes? Interpret the…
A: The regression line is given by score = 95 -1.2Size There is a negative relationship between the…
Q: Given the following Anova output of a regression output from MS Excel Source DF SS MS F…
A: Solution: k=4 independent variables n= 25 observation The ANOVA table is Source DF SS MS F…
Q: The following table presents data from a solar energy project: X (Deflexión) Y (Flujo de Calor)…
A: Hello thanks for your question. Since you have posted a question with multiple sub-parts, I will…
Q: Suppose we run the following regression JobStr B1 +B2 M+B Erp+ B, Edu + u to explain an individual's…
A: Given regression equation JobStr=β1+β2M+β3Exp+β4Edu+u The sample size =300The number of independent…
Q: Which sample result would provide evidence that there isan association between two quantitative…
A: In the simple linear regression, the test for slope tests the significance of the slope of the…
Q: An investigation was carried out on 10 second-hand cars to explore the relationship between the age…
A:
Q: Given the following Anova output of a regression output from MS Excel Source DF SS MS F…
A: Hey, since there are multiple subparts posted, we will answer first three subparts. If you want any…
Q: 9. A regression between foot length (response variable in cm) and height (explanatory variable in…
A: Let define the variables: x = height of the students y =Foot length of the students The given…
Q: Consider the following estimated regression with a sample of size n=50. AHE = -2.44 – 1.57 » DFemale…
A: While fitting a linear regression model, one of the most important assumption is the the variance of…
Q: Compute the two regression equations on the basis of the following information : Y Mean 40 45…
A:
Q: Consider the following Stata regression estimates (IDFB2) Source SS df MS Number of obs 935 F(3,…
A: There are 3 independent variables which are age, urban, IQ. The dependent variable is y. We have to…
Q: Use the following information from a multiple regression analysis. n=15 b1=2 b2=6 Sb1=1.4 Sb2=0.5 a.…
A: Solution: Given information: n= 15 observation k= 2 independent variables b1= 2b2= 6Sb1= 1.4Sb2=…
Q: The following results were obtained when each of a series of standard silver solutions was analyzed…
A: Hello! As you have posted more than 3 sub parts, we are answering the first 3 sub-parts. In case…
Q: Based on the following table, what is the sample regression equation? Standard Coefficients Error t…
A: We have been given the output of regression. We have the regression equation given as,…
Q: Use the information from a simple linear regression given in the table below to calculate a 95%…
A:
Q: Given below are seven observations collected in a regression study on two variables, x (independent…
A: x y 2 12 3 9 6 8 7 7 8 6 7 5 9 2
Q: The following data pertain to the marks in subjects A and B in a certain examination. Mean marks in…
A:
Q: The following sample observations were randomly selected. (Round intermediate calculations and final…
A: From the provided information, x 3 5 3 7 6 y 2 6 5 7 6
Q: The following data on x = the line speed (feet per minute) and y = the number of defective parts…
A: Obtain the 95% confidence interval for the mean number of defective parts for a line speed of 25…
Q: A labour welfare officer returns the following number of workers observed with certain classes of…
A: Solution:
Q: In my regression output using Hayes Model 1 I have the following results. Would it be safe to say…
A: 1. When we have the confidence interval which is not statistically significant. This implies that…
Q: The following observations are obtained from a random sample of 10 individuals: Individual x y 1…
A: x y 9.63 5.06 4.8 3.2 6.84 4.48 10.2 5.62 8.81 4.13 10.4 5.55 4.19 3.35 8.21 5.77…
Q: Given the following sample statistics X(bar) = 20, Y(bar) = 200, Sx= 100, Sy= 60, Rxy = 0.4, n= 50,…
A:
Q: Use least-squares regression to fit a straight line to х 6. 7 11 15 17 21 23 29 29 37 39 y 29 21 29…
A:
Q: In exercise 12, the following data on x = average daily hotel room rate and y = amount spent on…
A: a) Given that the regression equation is, ŷ = 17.49 + 1.0334x. Given that x=89. Substitute 89…
Q: Given are five observations for two variables, and y. 42 4 14 18 20 | S7 4 14 10 Ue the estimated…
A: (a) Obtain the value mean square error. The value mean square error is obtained below as follows:…
Q: Use the following information from a multiple regression analysis b, = 3 n= 20 b, = 2 So, = 1.1 S, =…
A:
Q: Given below are seven observations collected in a regression study on two variables, x (independent…
A: Regression is a numerical relationship between an explanatory variable and a response variable. In…
Q: Consider the following computer output from a multiple regression analysis relating the price of a…
A: Given info: The multiple analysis relating the price of a used car to the variables: age of car,…
Q: In a simple linear regression, given that the sample variances of x and y Sx^2=510, Sy^2=750…
A: Provided information is ; Sample variance of x=(Sx2 )= 510 , Sx=510 = 22.5832 Sample…
Q: The following data on price ($) and the overall score for 6 stereo headphones that were tested by…
A: For the given data Find all the required blanks
Q: The following is a partial computer output of a multiple regression analysis of a data set…
A: The provided information is: The regression equation is,SALEPRIC = 1470 + 0.814 LANDVAL + 0.820…
Q: The following data are the monthly salaries and the grade point averages for students who obtained…
A: a. The data related to the monthly salaries (y) and the grade point averages (x) for students, who…
Q: Consider the following estimated regression with a sample of size n=50: AHE = -2.44 – 1.57 • DFemale…
A: Given: AHE^=-2.44-1.57×DFemale+0.27×DMarried+0.59×Educ+0.04×Exper and the scatter plot
Q: A simple linear regression analysis involving 20 observations produced SSR = 96.78 and SSE = 43.22.…
A:
Q: The following are sample data provided by a movingcompany on the weights of six shipments, the…
A: (a) Excel Procedure: Enter the data for y, x1 and x2 in Excel>Data> Data Analysis.>…
Q: The following table lists the monthly incomes (in hundreds of dollars) and the monthly rents paid…
A: Note: Hey, since there are multiple subparts posted, we will answer first three subparts. If you…
Q: Construct a 95% confidence interval for the average value of y for the following data. Use x = 25,…
A: Solution: Given information: The estimated regression equation is y^= 16.920+0.160x Se= 4.77…
Q: c). Find the equation of the sample regression line using Minitab. d). Interpret the meaning of…
A: c) Let x be the price and y be the sales. The regression equation is obtained by using MINITAB:…


Trending now
This is a popular solution!

Step by step
Solved in 4 steps with 1 images

- Mr. James, president of Daniel-James Financial Services, believes that there is a relationship between the number of client contacts and the dollar amount of sales. To document this assertion, he gathered the following information from a sample of clients for the last month. Let X represent the number of times that the client was contacted and Y represent the valye of sales ($1000) for each client sampled. Number of Contacts (X) Sales ($1000) 14 24 12 14 20 28 16 30 23 30 a) Compute the regression equation for client contacts and sales. Interpret the slope and intercept parameters.Using the regression line attached. Based on only the above plot, one can conclude: a) height causes an increase in weight b) weight causes an increase in height c) taller people are more likely to weigh more than shorter people, at least in the sample on which this data is based d) a statistically significant predictive relationship between height and weight e) c and dSuppose the following data were collected from a sample of 15 houses relating selling price to square footage and the architectural style of the house. Use statistical software to find the following regression equation: PRICEi=b0+b1SQFTi+b2COLONIALi+b3RANCHi+ei . Is there enough evidence to support the claim that on average, houses that are ranch style have lower selling prices than houses that are Victorian style at the 0.05 level of significance? If yes, write the regression equation in the spaces provided with answers rounded to two decimal places. Else, select "There is not enough evidence."Selling Price Square Footage Colonial (1 if house is Colonial style, 0 otherwise) Ranch (1 if house is Ranch style, 0 otherwise) Victorian (1 if house is Victorian style, 0 otherwise) 377640 1941 1 0 0 460996 3397 0 1 0 405781 2764 0 0 1 407216 2906 0 0 1 435139 3401 1 0 0 405275 2600 0 0 1 381141 2203 0 1 0 370490 2046 1 0 0 404070 2210 0 0 1 460196 3692 0 1 0 382780 2172 1 0 0 406466 2606 0 1…
- A sociologist was hired by a large city hospital to investigate the relationship between the number of unauthorized days that employees are absent per year and the distance (miles) between home and work for the employee. A sample of 10 employees was chosen, and the following data were collected. A. Is the estimated regression equation appropriate and adequateThe following results are from data concerning the amount withdrawn from an ATM machine based on the amount of time spent at the ATM machine (SECONDS) and the gender, FEMALE (dummy variable = 1 for females and = 0 for males) and an interaction term, SECONDS*FEMALE Based on the regression results, if a male and female each spend the same amount of time at the ATM machine (say 27 seconds), how much more (or less) will a male withdraw? (if a male withdraws more then your answer should be a positive number and if a male withdraws less then your answer should be a negative number? (please express your answer using 1 decimal places)The Wall Street Journal asked Concur Technologies, Inc., an expense management company, to examine data from 8.3 million expense reports to provide insights regarding business travel expenses. Their analysis of the data showed that New York was the most expensive city. The following table shows the average daily hotel room rate (X) and the average amount spent on entertainment (Y) for a random sample of 9 of the 25 most-visited U.S. cities. These data lead to the estimated regression equation y = 17.49 + 1.0334x. For these data SSE = 1541.4. Use Table 1 of Appendix B. a. Predict the amount spent on entertainment for a particular city that has a daily room rate of $89 (to 2 decimals). b. Develop a 95% confidence interval for the mean amount spent on entertainment for all cities that have a daily room rate of $89 (to 2 decimals). c. The average room rate in Chicago is $128. Develop a 95% prediction interval for the amount spent on entertainment in Chicago (to 2 decimals).
- The Wall Street Journal asked Concur Technologies, Inc., an expense management company, to examine data from 8.3 million expense reports to provide insights regarding business travel expenses. Their analysis of the data showed that New York was the most expensive city. The following table shows the average daily hotel room rate (X) and the average amount spent on entertainment (Y) for a random sample of 9 of the 25 most-visited U.S. cities. These data lead to the estimated regression equation y = 17.49 + 1.0334x. For these data SSE = 1541.4. Use Table 1 of Appendix B. (NEED ANSWER FOR A) a. Predict the amount spent on entertainment for a particular city that has a daily room rate of $89 (to 2 decimals).The data from exercise 3 follow. xi 2 6 9 13 20 yi 7 18 9 26 23 The estimated regression equation is = 7.6 + .9x. What is the value of the standard error of the estimate (to 4 decimals)? What is the value of the t test statistic (to 2 decimals)? What is the p-value? Use Table 1 of Appendix B.Selectless than .01between .01 and .02between .02 and .05between .05 and .10between .10 and .20between .20 and .40greater than .40Item 3 What is your conclusion ( = .05)?SelectConclude a significant relationship exists between x and yCannot conclude a significant relationship exists between x and yItem 4 Use the F test to test for a significant relationship. Use = .05.Compute the value of the F test statistic (to 2 decimals). What is the p-value?Selectless than .01between .01 and .025between .025 and .05between .05 and .10greater than .10Item 6 What is your conclusion?SelectConclude a significant relationship exists between x and yCannot conclude a significant relationship exists…Bill is the office manager for a group of financial advisors who provide financial services for individual clients. She would like to investigate whether a relationship exists between the number of presentations made to prospective clients in a month and the number of new clients per month. The following table shows the number of presentations and corresponding new clients for a random sample of six employees. Employee Presentations New Clients 1 2 1 2 8 2 3 9 4 4 10 3 5 11 5 6 12 6 Bill would like to use simple regression analysis to estimate the number of new clients per month based on the number of presentations made by the employee per month. The average number of new clients per month for an employee who made 20 presentations per month is ________. 5.02 5.45 3.43 8.69
- Sarah is the office manager for a group of financial advisors who provide financial services for individual clients. She would like to investigate whether a relationship exists between the number of presentations made to prospective clients in a month and the number of new clients per month. The following table shows the number of presentations and corresponding new clients for a random sample of six employees. Employee Presentations New Clients 1 7 2 2 9 3 3 9 4 4 10 3 5 11 5 6 12 3 Sarah would like to use simple regression analysis to estimate the number of new clients per month based on the number of presentations made by the employee per month. The expected number of new clients per month for an employee who made 10 presentations per month is ________. 2.3982 1.6753 3.0521 3.4348Years of Work Experience and number of Job Offers of 10 job-seekers were as follows: Work Exp. 4 2 5 3 7 12 2 5 4 9 No. of Offers 7 1 8 4 13 19 3 11 9 15 a. Fit the regression equation of No. of Job Offers on Years of Work Experience. b. What will be the predicted number of offers for an applicant with 6 years of experience? c. Verify the relationship between the number of job offers and years of work experience using at least two relevant methodsA set of n = 15 pairs of X and Y values has a correlation of r = +0.80 with SSY = 75, and the regression equation for predicting Y is computed. Find the standard error of estimate for the regression equation. How big would the standard error be if the sample size were n = 30.
