Given are five observations for two variables, and y. 42 4 14 18 20 | S7 4 14 10 Ue the estimated regression equation is-67.-263e. a. Compute the mean square error using equation - MSE - SSE ea decima) b. Compute the standard eror of the estimate using equation. SSE VSESE (to 2 decima) e. Compute the estimated standard deviation of using equation.
Given are five observations for two variables, and y. 42 4 14 18 20 | S7 4 14 10 Ue the estimated regression equation is-67.-263e. a. Compute the mean square error using equation - MSE - SSE ea decima) b. Compute the standard eror of the estimate using equation. SSE VSESE (to 2 decima) e. Compute the estimated standard deviation of using equation.

Glencoe Algebra 1, Student Edition, 9780079039897, 0079039898, 2018
18th Edition
ISBN:9780079039897
Author:Carter
Publisher:Carter
Chapter4: Equations Of Linear Functions
Section4.6: Regression And Median-fit Lines
Problem 4GP

Related questions
Topic Video
Question
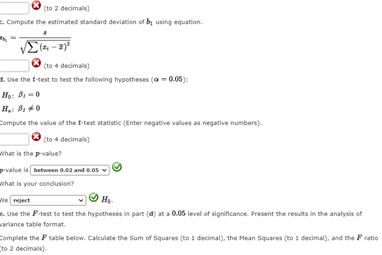
Transcribed Image Text:(to 2 decimals)
E. Compute the estimated standard deviation of by using equation.
(to 4 decimals)
3. Use the t-test to test the following hypotheses (a- 0.05):
Compute the value of the t-test statistic (Enter negative values as negative numbers).
O (to 4 decimals)
What is the p-value?
value is between 0.02 and 0.05
what is your conclusion?
ereject
H.
. Use the P-test to test the hypotheses in part (4) at a 0.05 level of sigrificance. Present the results in the analysis of
wariance table format.
Complete the Ftable below. Calculate the Sum of Squares (to 1 decimal), the Mean Squares (to 1 decimal), and the F ratio
Cto 2 decimals).
Transcribed Image Text:Check My Work
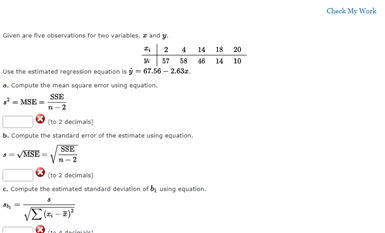
Given are five observations for two variables, z and y.
z | 2 4 14 18 20
* 57 58 46 14 10
Use the estimated regression equation is ý- 67.56 - 2.63z.
a. Compute the mean square error using equation.
SSE
- MSE
n-2
(to 2 decimals)
b. Compute the standard error of the estimate using equation.
SSE
-2
VMSE
(to 2 decimals)
c. Compute the estimated standard deviation of by using equation.
Expert Solution
This question has been solved!
Explore an expertly crafted, step-by-step solution for a thorough understanding of key concepts.

Step by step
Solved in 3 steps with 4 images

Knowledge Booster


Learn more about
Need a deep-dive on the concept behind this application? Look no further. Learn more about this topic, statistics and related others by exploring similar questions and additional content below.Recommended textbooks for you
Glencoe Algebra 1, Student Edition, 9780079039897…
Algebra
ISBN:
9780079039897
Author:
Carter
Publisher:
McGraw Hill
Glencoe Algebra 1, Student Edition, 9780079039897…
Algebra
ISBN:
9780079039897
Author:
Carter
Publisher:
McGraw Hill