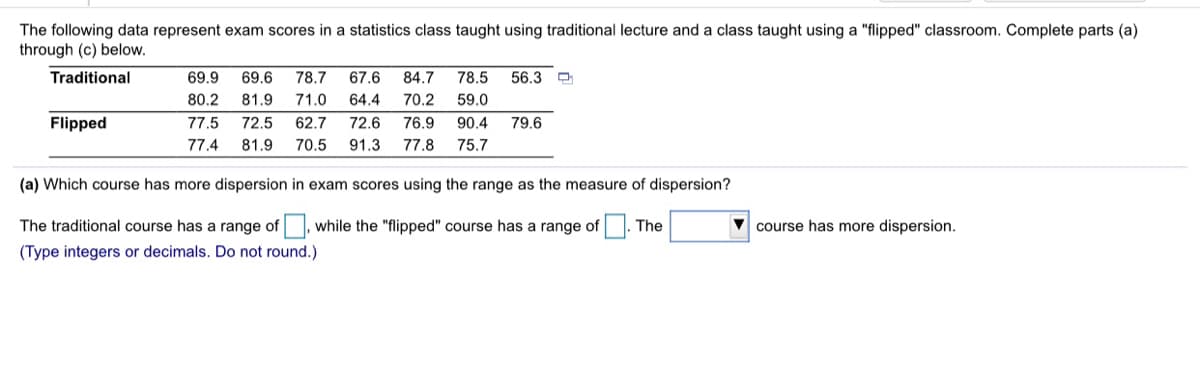
The following data represent exam scores in a statistics class taught using traditional lecture and a class taught using a "flipped" classroom. Complete parts (a) through (c) below. Traditional 69.9 69.6 78.7 67.6 84.7 78.5 56.3 D 80.2 81.9 71.0 64.4 70.2 59.0 Flipped 77.5 72.5 62.7 72.6 76.9 90.4 79.6 77.4 81.9 70.5 91.3 77.8 75.7 (a) Which course has more dispersion in exam scores using the range as the measure of dispersion? The traditional course has a range of, while the "flipped" course has a range of The course has more dispersion. (Type integers or decimals. Do not round.)


Inverse Normal Distribution
The method used for finding the corresponding z-critical value in a normal distribution using the known probability is said to be an inverse normal distribution. The inverse normal distribution is a continuous probability distribution with a family of two parameters.
Mean, Median, Mode
It is a descriptive summary of a data set. It can be defined by using some of the measures. The central tendencies do not provide information regarding individual data from the dataset. However, they give a summary of the data set. The central tendency or measure of central tendency is a central or typical value for a probability distribution.
Z-Scores
A z-score is a unit of measurement used in statistics to describe the position of a raw score in terms of its distance from the mean, measured with reference to standard deviation from the mean. Z-scores are useful in statistics because they allow comparison between two scores that belong to different normal distributions.
- Measure of dispersion :
To know the extent of variability in description of data , Measure of dispersion is useful. This is given by the measures of dispersion. Range, interquartile range, and standard deviation are the three commonly used measures of dispersion.
It help to interpret the variability of data i.e. to know how much homogenous or heterogeneous the data is. In simple terms, it shows how squeezed or scattered the variable is .
- Range :
The range is the difference between the largest and the smallest observation in the data. The main advantage of this measure of dispersion is that it is easy to calculate. It is very sensitive to outliers and does not use all the observations in a data set . It is more informative to provide the minimum and the maximum values rather than providing the range.
Range = Largest value - Smallest value

Trending now
This is a popular solution!

Step by step
Solved in 2 steps


