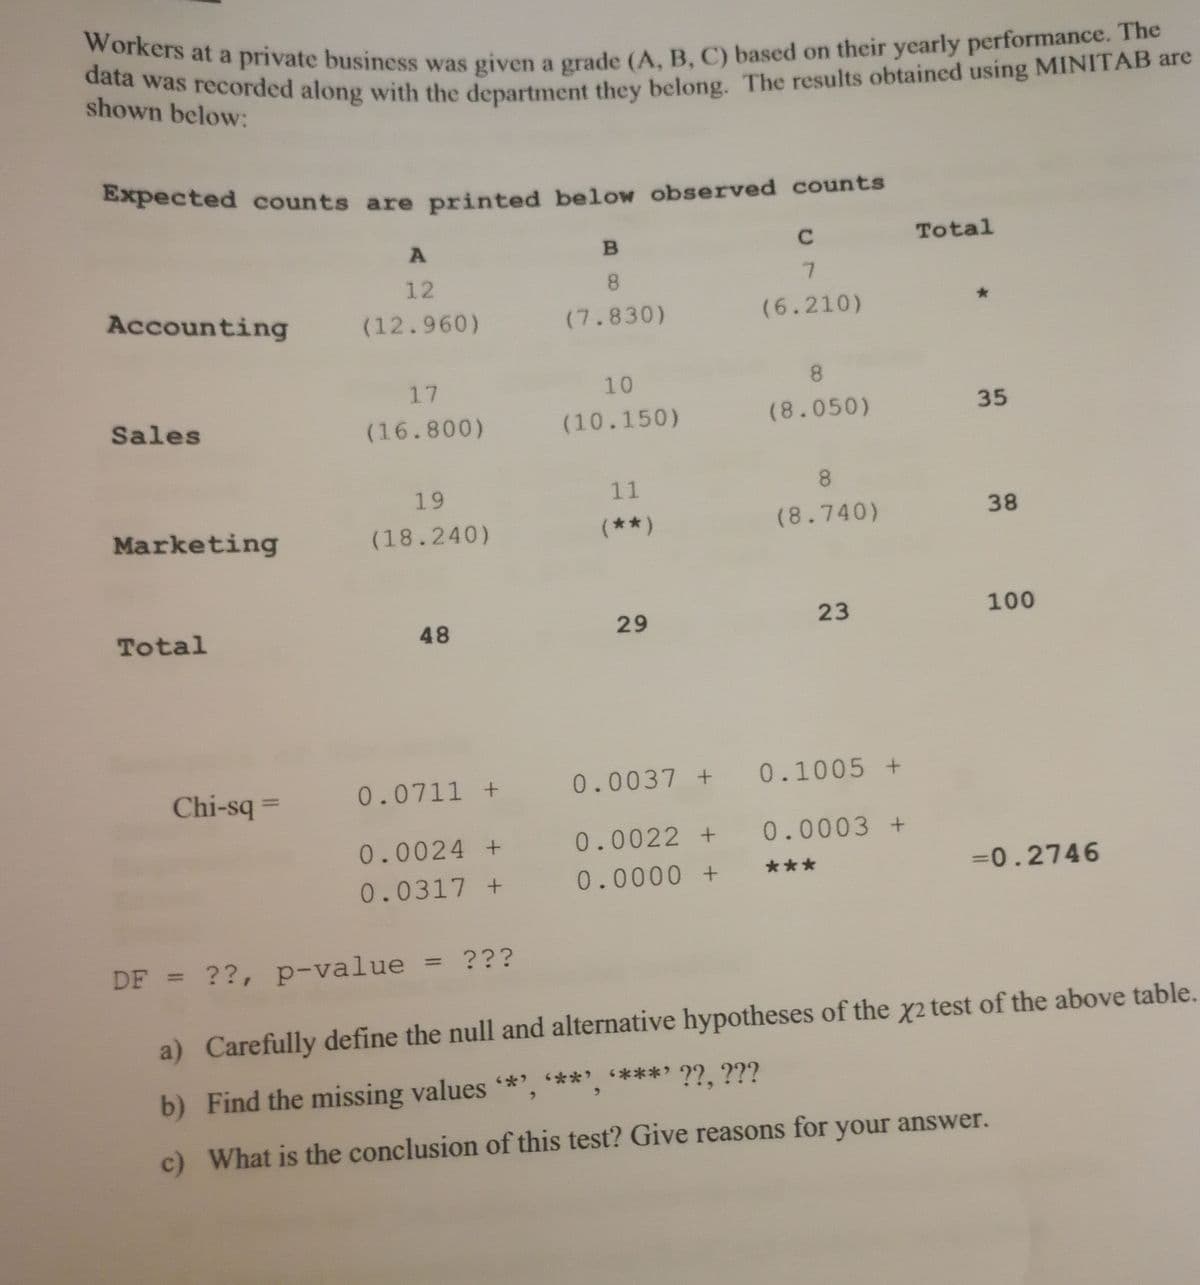
Workers at a private business was given a grade (A, B, C) based on their yearly performance. The data was recorded along with the department they belong. The results obtained using MINITAB are shown below: Apected counts are printed below observed counts B Total 12 8. 7. Accounting (12.960) (7.830) (6.210) 17 10 8. Sales (16.800) (10.150) (8.050) 35 19 11 8. Marketing (18.240) (**) (8.740) 38 Total 48 29 23 100 Chi-sq = 0.0711 + 0.0037 + 0.1005 + %3D 0.0024 + 0.0022 + 0.0003 + 0.0317 + 0.0000 + *** =0.2746 DF = ??, p-value = ??? a) Carefully define the null and alternative hypotheses of the x2 test of the above table. b) Find the missing values *', **', **** ??, ??? c) What is the conclusion of this test? Give reasons for your answer.


Inverse Normal Distribution
The method used for finding the corresponding z-critical value in a normal distribution using the known probability is said to be an inverse normal distribution. The inverse normal distribution is a continuous probability distribution with a family of two parameters.
Mean, Median, Mode
It is a descriptive summary of a data set. It can be defined by using some of the measures. The central tendencies do not provide information regarding individual data from the dataset. However, they give a summary of the data set. The central tendency or measure of central tendency is a central or typical value for a probability distribution.
Z-Scores
A z-score is a unit of measurement used in statistics to describe the position of a raw score in terms of its distance from the mean, measured with reference to standard deviation from the mean. Z-scores are useful in statistics because they allow comparison between two scores that belong to different normal distributions.

Step by step
Solved in 4 steps with 1 images


