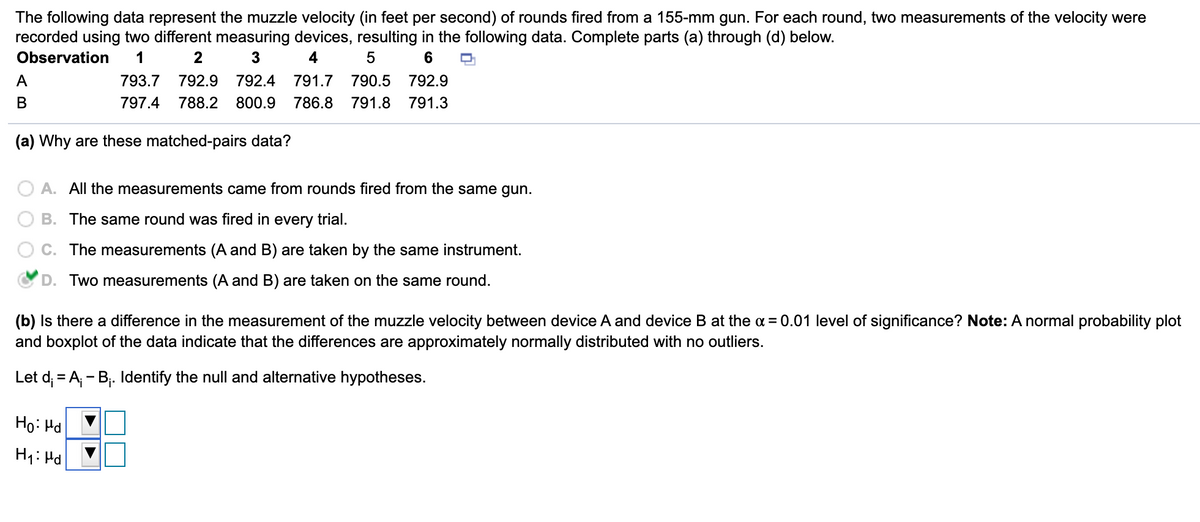
The following data represent the muzzle velocity (in feet per second) of rounds fired from a 155-mm gun. For each round, two measurements of the velocity were recorded using two different measuring devices, resulting in the following data. Complete parts (a) through (d) below. Observation 3 4 6. A 793.7 792.9 792.4 791.7 790.5 792.9 797.4 788.2 800.9 786.8 791.8 791.3 (a) Why are these matched-pairs data? O A. All the measurements came from rounds fired from the same gun. O B. The same round was fired in every trial. O C. The measurements (A and B) are taken by the same instrument. O D. Two measurements (A and B) are taken on the same round. (b) Is there a difference in the measurement of the muzzle velocity between device A and device B at the a = 0.01 level of significance? Note: A normal probability plot and boxplot of the data indicate that the differences are approximately normally distributed with no outliers. Let d; = A, - B,. Identify the null and alternative hypotheses.


Unitary Method
The word “unitary” comes from the word “unit”, which means a single and complete entity. In this method, we find the value of a unit product from the given number of products, and then we solve for the other number of products.
Speed, Time, and Distance
Imagine you and 3 of your friends are planning to go to the playground at 6 in the evening. Your house is one mile away from the playground and one of your friends named Jim must start at 5 pm to reach the playground by walk. The other two friends are 3 miles away.
Profit and Loss
The amount earned or lost on the sale of one or more items is referred to as the profit or loss on that item.
Units and Measurements
Measurements and comparisons are the foundation of science and engineering. We, therefore, need rules that tell us how things are measured and compared. For these measurements and comparisons, we perform certain experiments, and we will need the experiments to set up the devices.


Trending now
This is a popular solution!

Step by step
Solved in 3 steps


