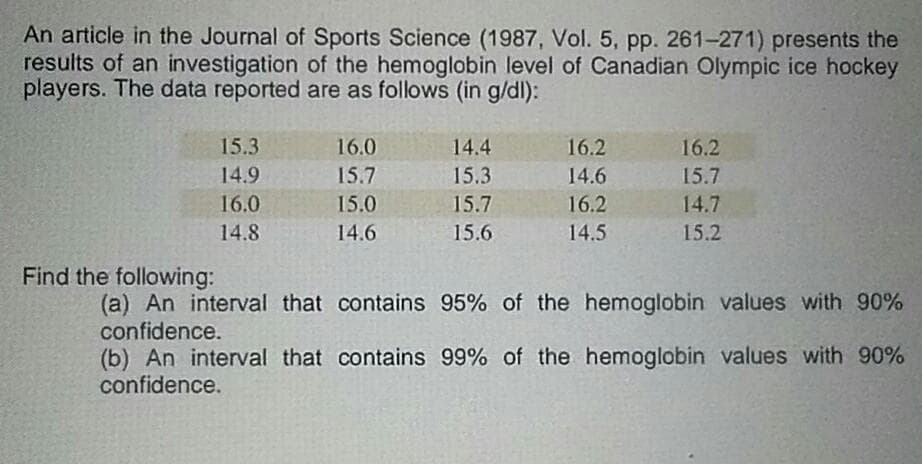
Ah artičlé in thế Journal of Sports Science (1987, Vol. 5, pp. 261-271) presents results of an investigation of the hemoglobin level of Canadian Olympic ice hock players. The data reported are as follows (in g/dl): 15.3 16.0 14.4 16.2 16.2 14.9 15.7 15.3 14.6 15.7 16.0 15.0 15.7 16.2 14.7 14.8 14.6 15.6 14.5 15.2


Q: Recently, researchers have begun to focus on the relationship between potentially toxic…
A: (A) The hypotheses are given below: Null hypothesis: H0:ρ=0 Alternative hypothesis: H1:ρ≠0…
Q: An articde in the ACI Materials Journal (val. 84, 1987, pp. 213-216) describes several experiments…
A: F test is used to make conclusions in the anova table. Anova table is used to measure the mean…
Q: The following table gives the distribtution of weekly income of 160 families in a town : Weekly…
A: Given : n = 160
Q: A artide in the ACI Materials Joumal (vol. 4, 1987. pp. 213-216) describes several experiments…
A:
Q: The weights (in pounds) of 6 vehicles and the variability of their braking distances (in feet)…
A: Sample size (n) = 6 The values of x and y are α=0.05
Q: The article "Modeling of Urban Area Stop-and-Go Traffic Noise" (P. Pamanikabud and C.…
A: Hypotheses and level of significance: Denote μ1 and μ2 as the mean noise level between acceleration…
Q: An article in the Journal of Agricultural Engineering Research (Vol. 52, 1992, pp. 53-76) describes…
A: Anova shows two source of variation, they are between treatment variation and within treatment…
Q: Find the correlation coefficient for each of the two data sets shown below. (a) (c)
A: Given: (a) x y 1 5 1 3 1 5 1 7 2 3 2 3 2 1 3 1 3 1 4 1 (c) x y 1 2…
Q: The following data for the dependent variable, y, and the independent variable, x, have been…
A: Solution: The given data is
Q: Does college grade point average (GPA) depend on gender? Does it depend on class (freshman,…
A: We have given two way ANOVA analysis and we have to answer question based on it.
Q: As part of a pilot study aimed at determining the daily consumption of water (in litres) across…
A:
Q: An article in the Journal of Agricultural Engineering Research (Vol. 52, 1992, pp. 53-76) describes…
A: given data We can find test statistic
Q: In an article in IEEE Transactions on Instrumentation and Measurement (2001, Vol. 50, pp. 986-990),…
A: Given that Supply Voltage(v) Current without Electronic(mA) 0.66 7.32 1.32 12.22 1.98 16.34…
Q: The spike stature of the plants grown from the seeds of the porcine separates (Dactylis glomerata L)…
A: Given nX=11, nY=10 X (x-x__)2 Y (y-y__)2 5 1 12 3.61 6 0 9 1.21 8 4 11 0.81 7 1 9 1.21…
Q: Cell Phone Radiation Listed below are the measured radiation absorption rates (in W/kg)…
A: For the given data construct boxplot and identify the five number summary.Software…
Q: Hoaglin, Mosteller, and Tukey (1983) present data on blood levels of beta-endorphin as a function of…
A: From the samples given n=19 As they are dependent samples the appropriate effect size can be Cohan’s…
Q: The following are the reaction times (in milliseconds) for randomly selected subjects who took…
A: The data of reaction times for randomly selected subjects who took either durg A or durg B is given…
Q: 6) The 2011-2012 tuitions for public colleges are described by the densitiy histogram Tuitions of…
A: Given a histogram showing the thousands of dollars and densities
Q: n artide in the Journal of Agricultural Engineering Research (Vol. 52, 1992, pp. 53-76) describes an…
A:
Q: An article in Plant Disease, "Effect of Nitrogen and Potassium Fertilizer Rates on Severity of…
A: Given:
Q: Look at the data for male student height and male student weight: 1.72 1.47 71 71 Ht (m) 1.65 1.75…
A: Note: " Since you have asked multiple question, we will solve the first question for you. If you…
Q: Immunization of Schoolchildren. In the article, “Reasons for Non-uptake of Measles, Mumps, and…
A: Cluster sampling is a sampling method in which the researcher divides the population into clusters,…
Q: The article “Assessment of Dermopharmacokinetic Approach in the Bioequivalence Determination of…
A: Hello there! Given question have more than three sub parts. According to our principles can answer…
Q: 3. Construct the scatterplots for the following bivariate data: a. Age of a person, in years 11 12…
A: Plot the points given in the table: Age 11 12 13 14 15 16 17 18 19 20 Weight 40 42 38 35 45 51…
Q: The following data concern the divorce rate (y) per 1,000 women and the percentage of the feme…
A: Given Information: The dependent variable (y) is the divorce rate. The Independent variable (x) is…
Q: A paper gave summary quantities for blood lead level (in micrograms per deciliter) for a sample of…
A: Note: As per our company guidelines, we are supposed to answer only the first question. Kindly…
Q: Compute the correlation between variable X and Y. X Y…
A: The data shows the variables X and Y.
Q: An article in the ACI Materials Journal (Vol. 84, 1987, pp. 213-216) describes several experiments…
A: There are 4 independent samples which follows normal distribution. We have to test whether there is…
Q: Listed below are the overhead widths (in cm) of seals measured from photographs and the weights…
A:
Q: Radiation in Baby Teeth Listed below are amounts of strontium-90 (in millibecquerels, or mBq) in a…
A: In this case we need to construct the boxplot for the amounts of strontium-90 and also identify the…
Q: We are testing whether a particular program of low impact exercise can improve the cholesterol level…
A: Solution: n= 38 Sample size x = ∑xn=266.938=7.0237 Sample mean s= ∑(x-x)2n-1s =1.6480 Sample…
Q: a) Use a calculator with mean and standard deviation keys to calculate x1, s1, x2, and s2. (Round…
A: (a) We can use calculator or Excel to calculate the required values. Pasting the values in Excel and…
Q: The data shown to the right for the dependent variable, y, and the independent variable, x, have…
A: The independent variable is x. The dependent variable is y. The given data represents simple linear…
Q: A researcher wanted to determine if carpeted rooms contain more bacteria than uncarpeted rooms. The…
A: Given that : X represent carpeted Y represents uncarpeted By using two sample t test we get…
Q: An article in the Journal of Agricultural Engineering Research (Vol. 52, 1992, pp. 53-76) describes…
A: Given data
Q: An economist wants to study the relationship between household income and saving. The following data…
A:
Q: According to the U.S. Climate Data website, the average monthly rainfall totals (in inches) in San…
A: Assuming the significance level is p=0.95
Q: We are testing whether a particular program of low impact exercise can improve the cholesterol level…
A: data is given
Q: In Design and Analysis of Experiments, 6th edition (John Wiley & Sons, 2005) D. C. Montgomery…
A:
Q: An article in the Food Technology Journal (1956, Vol. 10, pp. 39-42) described a study on the…
A: a) Solution: Since p-value<α, H0 is rejected. Some of the groups' averages consider to be not…
Q: In an investigation of the visual scanning behaviour of deaf children, measurements of eye movement…
A: Given Deaf children Normal children 1.81 0.95 2.2 1.49 3.29 1.12 2.13 1.07 2.55 1…
Q: Consider the average family income and annual savings of nine families shown below. Test the…
A: Solution-: We find the correlation coefficient =? Test the significance level of computed…
Q: The following table shows the typical depth (rounded to the nearest foot) for nonfailed wells in…
A:
Q: The data below are from a study comparing three different treatment conditions: Treatment 1…
A:
Q: An article in the ACI Materials Journal (Vol. 84, 1987, pp. 213-216) describes several experiments…
A:
Q: The following data represent soil water content (percent water by volume) for independent random…
A: The given information is the soil water content for the two independent random samples of soil taken…
Q: When water flows across farmland, some soil is washed away, resulting in erosion. An experiment was…
A: Given: The data given is as follows Flow rate 0.31 0.85 1.26 2.47 3.75 Eroded soil 0.82 1.95…
Q: The data shown to the right for the dependent variable, y, and the independent variable, x, have…
A: Given: The data are arranged in a ascending order. X Y 10 100 11 110 11 120 12 140 13…
Q: The following data represent soil water content (percent water by volume) for independent random…
A: The given information is the soil water content for the two independent random samples of soil taken…
please aasnwer:


Trending now
This is a popular solution!

Step by step
Solved in 3 steps


- An article in the Journal of Environmental Engineering (1989, Vol. 115(3), pp. 608–619) reported the results of a study on the occurrence of sodium and chloride in surface streams in central Rhode Island. The following data are chloride concentration y (in milligrams per liter) and roadway area in the watershed x (in percentage).A paper gave summary quantities for blood lead level (in micrograms per deciliter) for a sample of whites and a sample of African Americans. Data consistent with the given summary quantities is given below. Whites (W) 8.3 0.9 2.9 5.6 5.8 5.4 1.2 1.0 1.4 2.1 1.3 5.3 8.4 6.6 5.2 3.4 2.9 2.7 6.7 3.6 African Americans (AA) 4.8 1.4 0.9 10.8 2.4 0.6 5.0 5.4 6.1 2.9 5.0 2.1 7.5 3.4 13.6 1.4 3.7 3.3 14.8 3.9 (a) Calculate the values of the mean and the median for blood lead level for the sample of African Americans. mean median (b) Which of the mean or the median is larger? What characteristic of the data set explains the relative values of the mean and the median? The median is greater than the mean. This is explained by the fact that the distribution is positively skewed. The mean is greater than the median. This is explained by the fact that the distribution is positively skewed. The median is greater than the mean. This is explained by the fact that the…A paper gave summary quantities for blood lead level (in micrograms per deciliter) for a sample of whites and a sample of African Americans. Data consistent with the given summary quantities is given below. Whites (W) 8.3 0.9 2.9 5.6 5.8 5.4 1.2 1.0 1.4 2.1 1.3 5.3 8.4 6.6 5.2 3.6 2.9 2.7 6.7 3.8 African Americans (AA) 4.8 1.4 0.9 10.8 2.4 0.6 5.0 5.4 6.1 2.9 5.0 2.1 7.5 3.4 13.4 1.4 3.9 3.3 14.8 4.1 (a) Calculate the values of the mean and the median for blood lead level for the sample of African Americans. meanmedian (b) Which of the mean or the median is larger? What characteristic of the data set explains the relative values of the mean and the median? The mean is greater than the median. This is explained by the fact that the distribution is positively skewed.The median is greater than the mean. This is explained by the fact that the distribution is positively skewed. The median is greater than the mean. This is explained by the fact that the…
- rofessor Cornish studied rainfall cycles and sunspot cycles. (Reference: Australian Journal of Physics, Vol. 7, pp. 334-346.) Part of the data include amount of rain (in mm) for 6-day intervals. The following data give rain amounts for consecutive 6-day intervals at Adelaide, South Australia. 7 28 7 1 69 3 1 4 22 7 16 4 54 160 60 73 27 3 3 1 7 144 107 4 91 44 1 8 4 22 4 59 116 52 4 155 42 24 11 43 3 24 19 74 26 63 110 39 34 71 52 39 8 0 15 2 14 9 1 2 4 9 6 10 (i) Find the median. (Use 1 decimal place.)(ii) Convert this sequence of numbers to a sequence of symbols A and B, where A indicates a value above the median and B a value below the median. Test the sequence for randomness about the median at the 5% level of significance. (b) Find the number of runs R, n1, and n2. Let n1 = number of values above the median and n2 = number of values below the median. R n1 n2 (c) In the case, n1 > 20, we cannot use Table 10 of Appendix II to find the critical…The blood lead concentrations, in micrograms per deciliter (µg/dL), of 20 children from two different neighborhoods were measured. The results are recorded in the table. Neighborhood 1 3.97 3.92 3.99 3.71 4.13 3.97 4.02 3.88 4.12 3.70 3.96 3.78 4.30 4.09 4.13 4.94 3.93 3.95 3.86 3.83 Neighborhood 2 4.32 4.23 3.78 4.10 4.35 4.21 4.36 4.21 4.02 4.05 4.29 4.12 4.59 4.12 4.02 3.85 3.97 4.28 4.39 4.14 Using the same scale, draw a box-and-whisker plot for each of the two data sets, placing the second plot below the first. Considering that high blood lead concentrations are harmful to humans, in which of the two neighborhoods would you prefer to live? neighborhood1 or neighborhood 2Periodically, the county Water Department tests the drinking water of homeowners for contaminants such as lead and copper. The lead and copper levels in water specimens collected in 1998 for a sample of 10 residents of a subdevelopement of the county are shown below. lead (μμg/L) copper (mg/L) 4.44.4 0.6430.643 2.42.4 0.570.57 1.51.5 0.460.46 2.62.6 0.8950.895 5.95.9 0.20.2 3.43.4 0.540.54 3.83.8 0.2450.245 1.61.6 0.5830.583 5.75.7 0.7690.769 1.71.7 0.2150.215 (a) Construct a 9999% confidence interval for the mean lead level in water specimans of the subdevelopment. ≤μ≤≤μ≤ (b) Construct a 9999% confidence interval for the mean copper level in water specimans of the subdevelopment. ≤μ≤≤μ≤
- The caloric content (in calories) and sodium content (in mg) were collected for 27 beef hotdogs. The data are in the table below. X, caloric content Y, sodium content 141 386 153 401 139 322 135 298 157 440 149 319 184 482 140 326 185 486 187 499 186 495 175 479 191 591 159 374 111 300 149 379 190 587 177 429 176 425 190 645 131 317 148 375 132 253 182 481 176 483 181 477 149 322How sensitive to changes in water temperature are coral reefs? To find out, scientists examined data on sea surface temperatures, in degrees Celsius, and mean coral growth, in centimeters per year, over a several‑year period at locations in the Gulf of Mexico and the Caribbean Sea. The table shows the data for the Gulf of Mexico. Sea surface temperature 26.726.7 26.626.6 26.626.6 26.526.5 26.326.3 26.126.1 Growth 0.850.85 0.850.85 0.790.79 0.860.86 0.890.89 0.920.92 (b) Find the correlation ?r step by step. Round off to two decimals places in each step. First, find the mean and standard deviation of each variable. Then, find the six standardized values for each variable. Finally, use the formula for ?r . Round your answer to three decimal places.An article in the Journal of Applied Polymer Science (Vol. 56, pp. 471–476, 1995) studied the effect of the mole ratio of sebacic acid on the intrinsic viscosity of copolyesters.- The data follows: Viscosity 0.45 0.2 0.34 0.58 0.7 0.57 0.55 0.44 Mole ratio 1 0.9 0.8 0.7 0.6 0.5 0.4 0.3 (a) Construct a scatter diagram of the data.
- The data shown below represent the repair cost for a low-impact collision in a simple random sample of mini- and micro-vehicles (such as the Chevrolet Aveo or Mini Cooper). Complete parts (a) through (c).Recently, researchers have begun to focus on the relationship between potentially toxic environmental exposures in children to a number of adverse health outcomes. Suppose one such researcher wants to investigate the relationship between lead levels in soil (micrograms/dL) and BMI (kg/m2). The following table represents a SRS of households with the corresponding exterior lead levels and BMI of a randomly sampled child in the home. Lead levels BMI 13.6 19.7 14.3 19.9 9.7 20.1 9.4 22.1 11.4 19.8 10.9 21.6 A) Write out the null and alternative hypotheses for a formal test of significance testing the correlation between the two variables and calulate a t statistic and interpret your pvalue and results.The article “Assessment of Dermopharmacokinetic Approach in the Bioequivalence Determination of Topical Tretinoin Gel Products” (L. Pershing, J. Nelson, et al., J Am Acad Dermatol 2003:740–751) reports that the amount of a certain antifungal ointment that is absorbed into the skin can be modeled with a lognormal distribution. Assume that the amount (in ng/cm²) of active ingredient in the skin two hours after application is lognormally distributed with μ = 2.2 and σ = 2.1. a) Find the mean amount absorbed. b) Find the median amount absorbed. c) Find the probability that the amount absorbed is more than 100 ng/cm². d) Find the probability that the amount absorbed is less than 50 ng/cm². e) Find the 80th percentile of the amount absorbed. f) Find the standard deviation of the amount absorbed.
