The following diagram represents the money market in the United States, which is currently in equilibrium, as indicated by the grey star. Suppose the Federal Reserve (the Fed) announces that it is raising its target interest rate by 25 basis points, or 0.25%. It would achieve this by decrease increasethe money supply money demand. Use the green line (triangle symbols) on the preceding graph to illustrate the effects of this policy. Place the black point (plus
The following diagram represents the money market in the United States, which is currently in equilibrium, as indicated by the grey star. Suppose the Federal Reserve (the Fed) announces that it is raising its target interest rate by 25 basis points, or 0.25%. It would achieve this by decrease increasethe money supply money demand. Use the green line (triangle symbols) on the preceding graph to illustrate the effects of this policy. Place the black point (plus

Chapter15: Monetary Theory And Policy
Section: Chapter Questions
Problem 1.2P

Related questions
Question
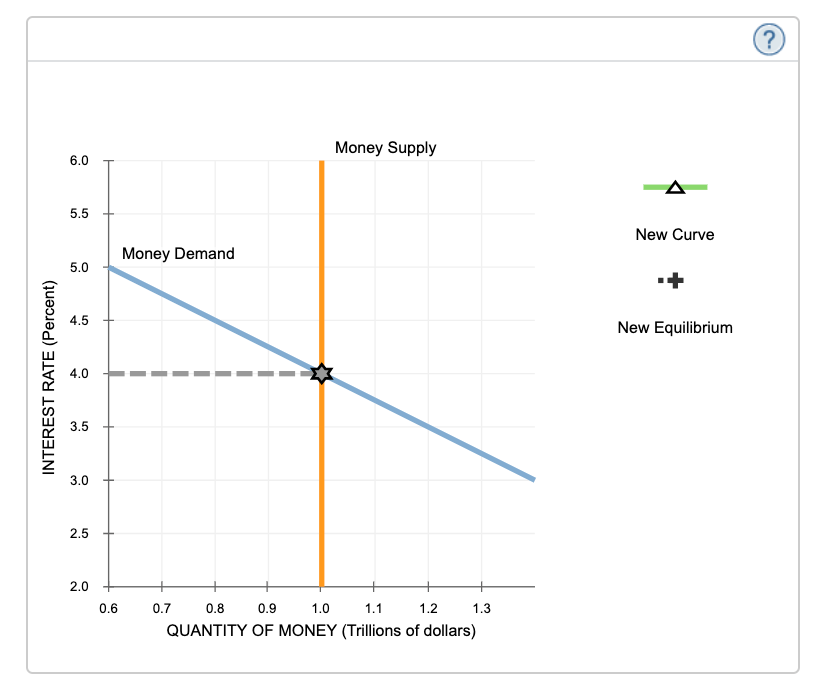
Equilibrium and disequilibrium in the money market
The following diagram represents the money market in the United States, which is currently in equilibrium, as indicated by the grey star.
Suppose the Federal Reserve (the Fed) announces that it is raising its target interest rate by 25 basis points, or 0.25%. It would achieve this by
the
. Use the green line (triangle symbols) on the preceding graph to illustrate the effects of this policy. Place the black point (plus symbol) on the graph to indicate the new equilibrium interest rate and quantity of money.
| decrease | increase |
| money supply | money demand |
The sequence of events that results in a new equilibrium interest rate, after the Fed makes the change you selected, may be described as follows: Because there is
money in the financial system, the quantity of money demanded
, which means that bond issuers
sell bonds. This process continues until the new equilibrium interest rate is achieved.
| more | less |
| increases | decreases |
|
can issue bonds at lower interest rates and still
|
must raise the interest they pay |
Transcribed Image Text:Money Supply
6.0
5.5
New Curve
Money Demand
5.0
4.5
New Equilibrium
4.0
3.5
3.0
2.5
2.0
0.6
0.7
0.8
0.9
1.0
1.1
1.2
1.3
QUANTITY OF MONEY (Trillions of dollars)
INTEREST RATE (Percent)
Expert Solution
This question has been solved!
Explore an expertly crafted, step-by-step solution for a thorough understanding of key concepts.

This is a popular solution!

Trending now
This is a popular solution!

Step by step
Solved in 2 steps with 1 images

Knowledge Booster


Learn more about
Need a deep-dive on the concept behind this application? Look no further. Learn more about this topic, economics and related others by exploring similar questions and additional content below.Recommended textbooks for you

Economics (MindTap Course List)
Economics
ISBN:
9781337617383
Author:
Roger A. Arnold
Publisher:
Cengage Learning

Economics (MindTap Course List)
Economics
ISBN:
9781337617383
Author:
Roger A. Arnold
Publisher:
Cengage Learning

Principles of Economics 2e
Economics
ISBN:
9781947172364
Author:
Steven A. Greenlaw; David Shapiro
Publisher:
OpenStax

