The following estimated regression equation is based on 10 observations was presented. ŷ = 29.1270 + 0.5906x1 + 0.4980x2 Here SST = 6,898.250, SSR = 6,009.500, Sb, = 0.0712, and S, = 0.0566. a. Compute MSR and MSE (to 3 decimals). MSR MSE 0.05. Use the F table. b. Compute F and perform the appropriate F test (to 2 decimals). Use a = F =| The p-value isSelect your answer - At a = 0.05, the overall model is -Select your answer c. Perform a t test for the significance of B1 (to 2 decimals). Use a = 0.05. Use the i table. to = The p-value is Select your answer At a = 0.05, there is Select your answer - | relationship between y and e1 d. Perform a t test for the significance of B2 (to 2 decimals). Use a = 0.05. Use the t table. to = The p-value is At a = 0.05, there is Select your answer Select your answer relationship between y and e2.

College Algebra
7th Edition
ISBN:9781305115545
Author:James Stewart, Lothar Redlin, Saleem Watson
Publisher:James Stewart, Lothar Redlin, Saleem Watson
Chapter1: Equations And Graphs
Section: Chapter Questions
Problem 10T: Olympic Pole Vault The graph in Figure 7 indicates that in recent years the winning Olympic men’s...
icon
Related questions
icon
Concept explainers
Question
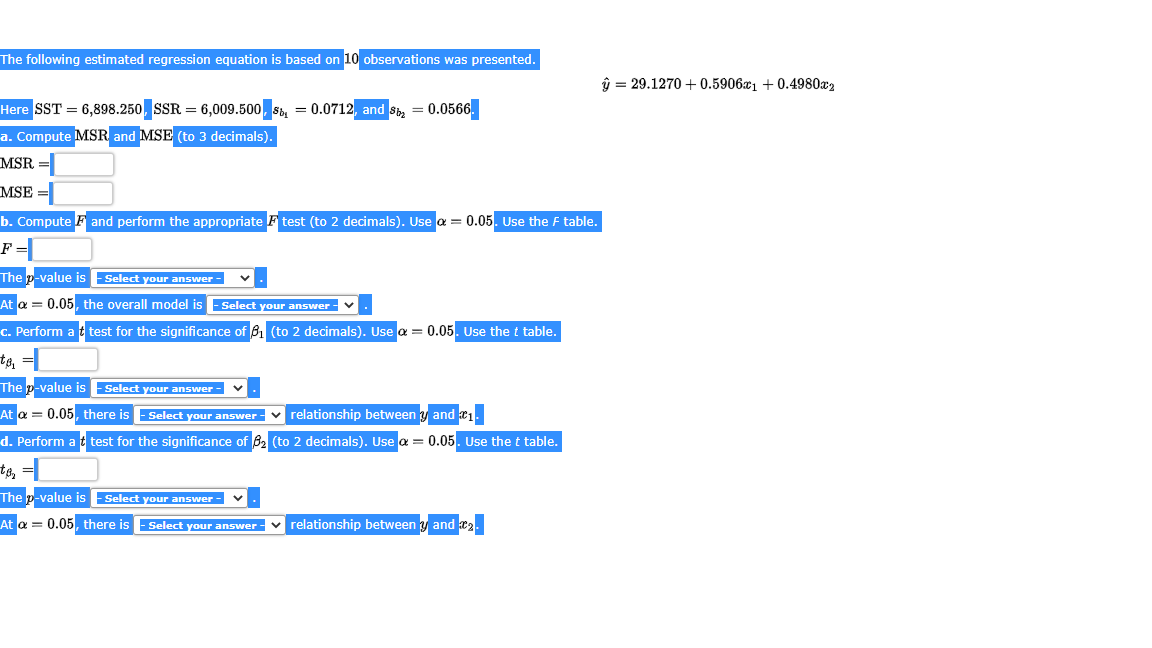
The following estimated regression equation is based on 10 observations was presented.
ŷ = 29.1270 + 0.590601 + 0.4980x2
Here SST = 6,898.250, SSR = 6,009.500, S, = 0.0712, and S, = 0.0566.
a. Compute MSR and MSE (to 3 decimals).
MSR
MSE
b. Compute F and perform the appropriate F test (to 2 decimals). Use a = 0.05. Use the F table.
F=
The p-value is Select your answer -
At a = 0.05, the overall model is -Select your answer -
c. Perform a t test for the significance of 61 (to 2 decimals). Use a = 0.05. Use the t table.
The p-value is Select your answer -
At a = 0.05, there is - Select your answer-
v relationship between y and a1.
d. Perform a t test for the significance of 82 (to 2 decimals). Use a = 0.05. Use the t table.
The p-value is Select your answer -
At a = 0.05, there is
- Select your answer - v relationship between y and 2.
Transcribed Image Text:The following estimated regression equation is based on 10 observations was presented. ŷ = 29.1270 + 0.590601 + 0.4980x2 Here SST = 6,898.250, SSR = 6,009.500, S, = 0.0712, and S, = 0.0566. a. Compute MSR and MSE (to 3 decimals). MSR MSE b. Compute F and perform the appropriate F test (to 2 decimals). Use a = 0.05. Use the F table. F= The p-value is Select your answer - At a = 0.05, the overall model is -Select your answer - c. Perform a t test for the significance of 61 (to 2 decimals). Use a = 0.05. Use the t table. The p-value is Select your answer - At a = 0.05, there is - Select your answer- v relationship between y and a1. d. Perform a t test for the significance of 82 (to 2 decimals). Use a = 0.05. Use the t table. The p-value is Select your answer - At a = 0.05, there is - Select your answer - v relationship between y and 2.
Expert Solution
trending now

Trending now

This is a popular solution!

steps

Step by step

Solved in 4 steps

Blurred answer
Knowledge Booster
Correlation, Regression, and Association
Learn more about
Need a deep-dive on the concept behind this application? Look no further. Learn more about this topic, statistics and related others by exploring similar questions and additional content below.
Similar questions
  • SEE MORE QUESTIONS
Recommended textbooks for you
College Algebra
College Algebra
Algebra
ISBN:
9781305115545
Author:
James Stewart, Lothar Redlin, Saleem Watson
Publisher:
Cengage Learning
Algebra and Trigonometry (MindTap Course List)
Algebra
ISBN:
9781305071742
Author:
James Stewart, Lothar Redlin, Saleem Watson
Publisher:
Cengage Learning
Functions and Change: A Modeling Approach to Coll…
Algebra
ISBN:
9781337111348
Author:
Bruce Crauder, Benny Evans, Alan Noell
Publisher:
Cengage Learning