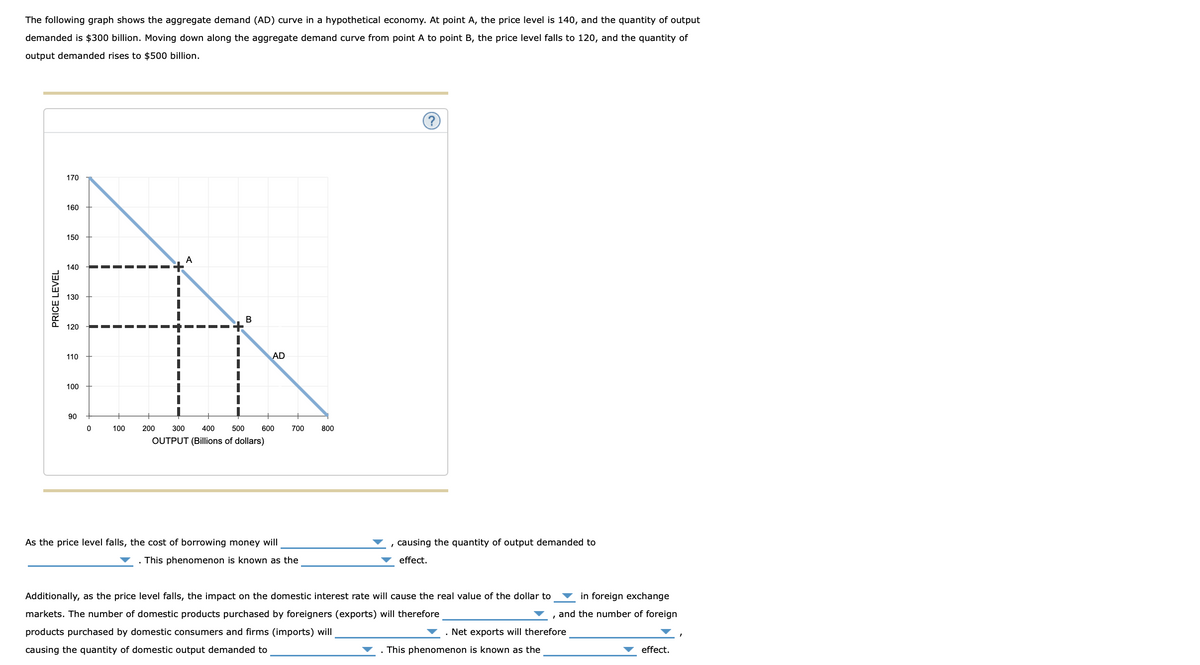
The following graph shows the aggregate demand (AD) curve in a hypothetical economy. At point A, the price level is 140, and the quantity of output demanded is $300 billion. Moving down along the aggregate demand curve from point A to point B, the price level falls to 120, and the quantity of output demanded rises to $500 billion. 170 160 150 140 130 120 110 AD 100 90 100 200 300 400 500 600 700 800 OUTPUT (Billions of dollars) As the price level falls, the cost of borrowing money will causing the quantity of output demanded to - This phenomenon is known as the effect. Additionally, as the price level falls, the impact on the domestic interest rate will cause the real value of the dollar to in foreign exchange markets. The number of domestic products purchased by foreigners (exports) will therefore and the number of foreign - Net exports will therefore - This phenomenon is known as the products purchased by domestic consumers and firms (imports) will causing the quantity of domestic output demanded to effect. PRICE LEVEL
The following graph shows the aggregate demand (AD) curve in a hypothetical economy. At point A, the price level is 140, and the quantity of output demanded is $300 billion. Moving down along the aggregate demand curve from point A to point B, the price level falls to 120, and the quantity of output demanded rises to $500 billion. 170 160 150 140 130 120 110 AD 100 90 100 200 300 400 500 600 700 800 OUTPUT (Billions of dollars) As the price level falls, the cost of borrowing money will causing the quantity of output demanded to - This phenomenon is known as the effect. Additionally, as the price level falls, the impact on the domestic interest rate will cause the real value of the dollar to in foreign exchange markets. The number of domestic products purchased by foreigners (exports) will therefore and the number of foreign - Net exports will therefore - This phenomenon is known as the products purchased by domestic consumers and firms (imports) will causing the quantity of domestic output demanded to effect. PRICE LEVEL

Economics (MindTap Course List)
13th Edition
ISBN:9781337617383
Author:Roger A. Arnold
Publisher:Roger A. Arnold
Chapter8: Aggregate Demand And Aggregate Supply
Section: Chapter Questions
Problem 1QP

Related questions
Question
Transcribed Image Text:The following graph shows the aggregate demand (AD) curve in a hypothetical economy. At point A, the price level is 140, and the quantity of output
demanded is $300 billion. Moving down along the aggregate demand curve from point A to point B, the price level falls to 120, and the quantity of
output demanded rises to $500 billion.
170
160
150
A
140
130
B
120
110
AD
100
90
100
200
300
400
500
600
700
800
OUTPUT (Billions of dollars)
As the price level falls, the cost of borrowing money will
causing the quantity of output demanded to
This phenomenon is known as the
effect.
Additionally, as the price level falls, the impact on the domestic interest rate will cause the real value of the dollar to
in foreign exchange
markets. The number of domestic products purchased by foreigners (exports) will therefore
and the number of foreign
products purchased by domestic consumers and firms (imports) will
Net exports will therefore
causing the quantity of domestic output demanded to
. This phenomenon is known as the
effect.
PRICE LEVEL
Expert Solution
This question has been solved!
Explore an expertly crafted, step-by-step solution for a thorough understanding of key concepts.

This is a popular solution!

Trending now
This is a popular solution!

Step by step
Solved in 2 steps

Knowledge Booster


Learn more about
Need a deep-dive on the concept behind this application? Look no further. Learn more about this topic, economics and related others by exploring similar questions and additional content below.Recommended textbooks for you
Economics (MindTap Course List)
Economics
ISBN:
9781337617383
Author:
Roger A. Arnold
Publisher:
Cengage Learning

Economics (MindTap Course List)
Economics
ISBN:
9781337617383
Author:
Roger A. Arnold
Publisher:
Cengage Learning