The following graph shows the labor market for research assistants in the fictional country of Collegia. The equilibrium wage is $10 per hour, and the equilibrium number of research assistants is 250. Suppose the government has decided to institute a $4-per-hour payroll tax on research assistants and is trying to determine whether the tax should be levied on the employer, the workers, or both (such that half the tax is collected from each side). Use the graph input tool to evaluate these three proposals. Entering a number into the Tax Levied on Employers field (initially set at zero dollars per hour) shifts the demand curve down by the amount you enter, and entering a number into the Tax Levied on Workers field (initially set at zero dollars per hour) shifts the supply curve up by the amount you enter. To determine the before-tax wage for each tax proposal, adjust the amount in the Wage field until the quantity of labor supplied equals the quantity of labor demanded. You will not be graded on any changes you make to this graph. Note: Once you enter a value in a white field, the graph and any corresponding amounts in each grey field will change accordingly. Graph Input Tool (? Market for Research Assistants 20 18 I Wage (Dollars per hour) 16 Supply Labor Demanded (Number of workers) Labor Supplied (Number of workers) 625 14 12 Demand Shifter Supply Shifter 10 Demand Tax Levied on Employers (Dollars per hour) Tax Levied on Workers (Dollars per hour) 4. 2 50 100 150 200 250 300 350 400 450 500 LABOR (Number of workers) WAGE (Dollars per hour)
The following graph shows the labor market for research assistants in the fictional country of Collegia. The equilibrium wage is $10 per hour, and the equilibrium number of research assistants is 250. Suppose the government has decided to institute a $4-per-hour payroll tax on research assistants and is trying to determine whether the tax should be levied on the employer, the workers, or both (such that half the tax is collected from each side). Use the graph input tool to evaluate these three proposals. Entering a number into the Tax Levied on Employers field (initially set at zero dollars per hour) shifts the demand curve down by the amount you enter, and entering a number into the Tax Levied on Workers field (initially set at zero dollars per hour) shifts the supply curve up by the amount you enter. To determine the before-tax wage for each tax proposal, adjust the amount in the Wage field until the quantity of labor supplied equals the quantity of labor demanded. You will not be graded on any changes you make to this graph. Note: Once you enter a value in a white field, the graph and any corresponding amounts in each grey field will change accordingly. Graph Input Tool (? Market for Research Assistants 20 18 I Wage (Dollars per hour) 16 Supply Labor Demanded (Number of workers) Labor Supplied (Number of workers) 625 14 12 Demand Shifter Supply Shifter 10 Demand Tax Levied on Employers (Dollars per hour) Tax Levied on Workers (Dollars per hour) 4. 2 50 100 150 200 250 300 350 400 450 500 LABOR (Number of workers) WAGE (Dollars per hour)

Principles of Microeconomics
7th Edition
ISBN:9781305156050
Author:N. Gregory Mankiw
Publisher:N. Gregory Mankiw
Chapter6: Supply, Demand And Government Policies
Section: Chapter Questions
Problem 4PA

Related questions
Question
would you help me with this homework please? thank you

Transcribed Image Text:6. Who should pay the tax?
The following graph shows the labor market for research assistants in the fictional country of Collegia. The equilibrium wage is $10 per hour, and the
equilibrium number of research assistants is 250.
Suppose the government has decided to institute a $4-per-hour payroll tax on research assistants and is trying to determine whether the tax should
be levied on the employer, the workers, or both (such that half the tax is collected from each side).
Use the graph input tool to evaluate these three proposals. Entering a number into the Tax Levied on Employers field (initially set at zero dollars per
hour) shifts the demand curve down by the amount you enter, and entering a number into the Tax Levied on Workers field (initially set at zero dollars
per hour) shifts the supply curve up by the amount you enter. To determine the before-tax wage for each tax proposal, adjust the amount in the
Wage field until the quantity of labor supplied equals the quantity of labor demanded. You will not be graded on any changes you make to this graph.
Note: Once you enter a value in a white field, the graph and any corresponding amounts in each grey field will change accordingly.
Graph Input Tool
Market for Research Assistants
20
18
I Wage
(Dollars per hour)
4
16
Labor Supplied
(Number of workers)
Labor Demanded
Supply
625
14
(Number of workers)
12
Demand Shifter
Supply Shifter
Demand
Tax Levied on
Employers
(Dollars per hour)
Tax Levied on
Workers
(Dollars per hour)
6
4
50
100 150 200 250 300 350 400 450 500
LABOR (Number of workers)
WAGE (Dollars per hour)
10
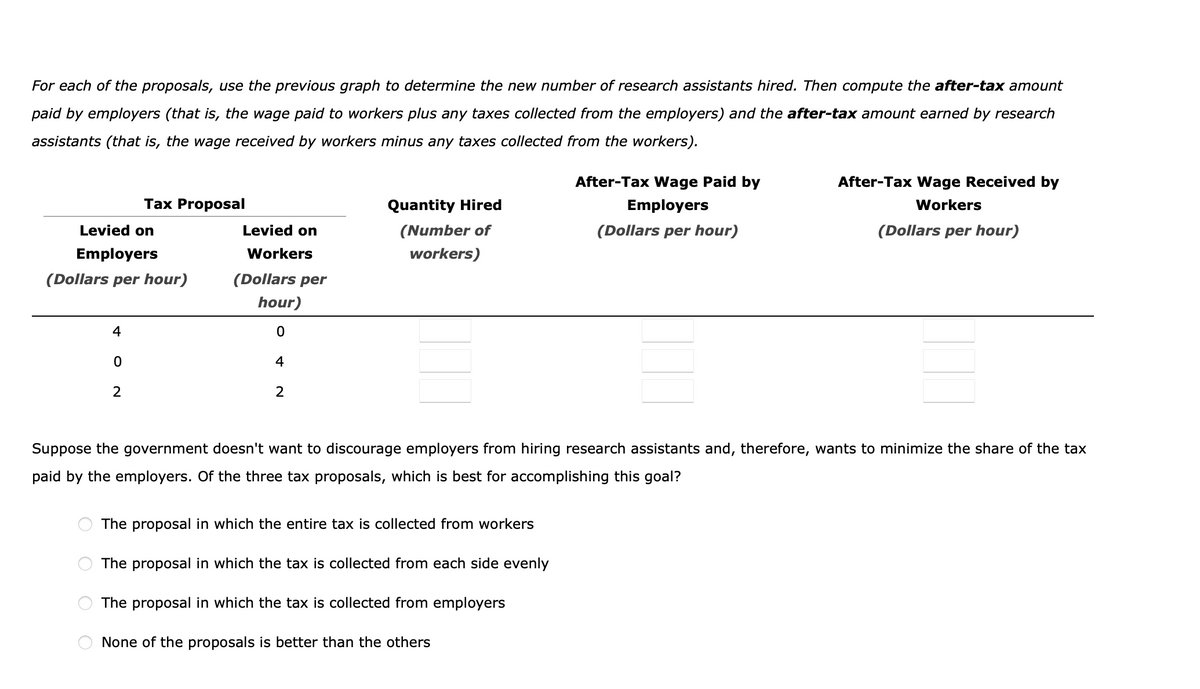
Transcribed Image Text:For each of the proposals, use the previous graph to determine the new number of research assistants hired. Then compute the after-tax amount
paid by employers (that is, the wage paid to workers plus any taxes collected from the employers) and the after-tax amount earned by research
assistants (that is, the wage received by workers minus any taxes collected from the workers).
After-Tax Wage Paid by
After-Tax Wage Received by
Tax Proposal
Quantity Hired
Employers
Workers
Levied on
Levied on
(Number of
(Dollars per hour)
(Dollars per hour)
Employers
Workers
workers)
(Dollars per hour)
(Dollars per
hour)
4
4
2
2
Suppose the government doesn't want to discourage employers from hiring research assistants and, therefore, wants to minimize the share of the tax
paid by the employers. Of the three tax proposals, which is best for accomplishing this goal?
The proposal in which the entire tax is collected from workers
The proposal in which the tax is collected from each side evenly
The proposal in which the tax is collected from employers
None of the proposals is better than the others
O O O
Expert Solution
This question has been solved!
Explore an expertly crafted, step-by-step solution for a thorough understanding of key concepts.

This is a popular solution!

Trending now
This is a popular solution!

Step by step
Solved in 4 steps with 2 images

Knowledge Booster


Learn more about
Need a deep-dive on the concept behind this application? Look no further. Learn more about this topic, economics and related others by exploring similar questions and additional content below.Recommended textbooks for you
Principles of Microeconomics
Economics
ISBN:
9781305156050
Author:
N. Gregory Mankiw
Publisher:
Cengage Learning

Principles of Microeconomics (MindTap Course List)
Economics
ISBN:
9781305971493
Author:
N. Gregory Mankiw
Publisher:
Cengage Learning

Principles of Macroeconomics (MindTap Course List)
Economics
ISBN:
9781285165912
Author:
N. Gregory Mankiw
Publisher:
Cengage Learning
Principles of Microeconomics
Economics
ISBN:
9781305156050
Author:
N. Gregory Mankiw
Publisher:
Cengage Learning
Principles of Microeconomics (MindTap Course List)
Economics
ISBN:
9781305971493
Author:
N. Gregory Mankiw
Publisher:
Cengage Learning
Principles of Macroeconomics (MindTap Course List)
Economics
ISBN:
9781285165912
Author:
N. Gregory Mankiw
Publisher:
Cengage Learning

Essentials of Economics (MindTap Course List)
Economics
ISBN:
9781337091992
Author:
N. Gregory Mankiw
Publisher:
Cengage Learning


Principles of Macroeconomics (MindTap Course List)
Economics
ISBN:
9781305971509
Author:
N. Gregory Mankiw
Publisher:
Cengage Learning