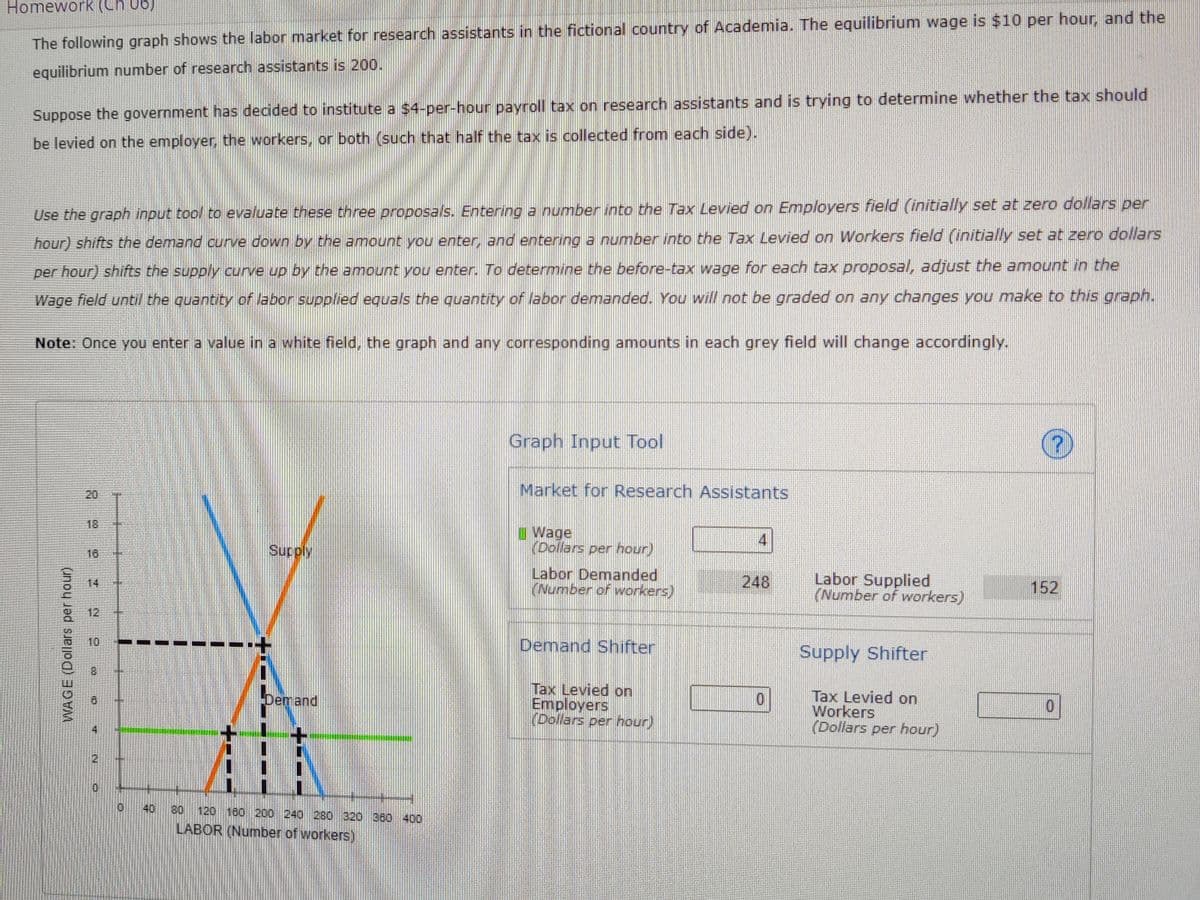
Homework (Ch 06) The following graph shows the labor market for research assistants in the fictional country of Academia. The equilibrium wage is $10 per hour, and tl equilibrium number of research assistants is 200. Suppose the government has decided to institute a $4-per-hour payroll tax on research assistants and is trying to determine whether the tax should be levied on the employer, the workers, or both (such that half the tax is collected from each side). Use the graph input tool to evaluate these three proposals. Entering a number into the Tax Levied on Employers field (initially set at zero dollars per hour) shifts the demand curve down by the amount you enter, and entering a number into the Tax Levied on Workers field (initially set at zero dolla per hour) shifts the supply curve up by the amount you enter. To determine the before-tax wage for each tax proposal, adjust the amount in the Wage field until the quantity of labor supplied equals the quantity of labor demanded. You will not be graded on any changes you make to this graph Note: Once you enter a value in a white field, the graph and any corresponding amounts in each grey field will change accordingly. Graph Input Tool Market for Research Assistants 20 18 I Wage (Dollars per hour) 4 Supply 16 Labor Demanded (Number of workers) Labor Supplied (Number of workers) 14 248 152 12 10 Demand Shifter Supply Shifter Tax Levied on Employers (Dollars per hour) Tax Levied on Workers (Dollars per hour) Dem and 14 40 80 120 100 200 240 280 320 360 400 LABOR (Number of workers) WAGE (Dollars per hour)
Homework (Ch 06) The following graph shows the labor market for research assistants in the fictional country of Academia. The equilibrium wage is $10 per hour, and tl equilibrium number of research assistants is 200. Suppose the government has decided to institute a $4-per-hour payroll tax on research assistants and is trying to determine whether the tax should be levied on the employer, the workers, or both (such that half the tax is collected from each side). Use the graph input tool to evaluate these three proposals. Entering a number into the Tax Levied on Employers field (initially set at zero dollars per hour) shifts the demand curve down by the amount you enter, and entering a number into the Tax Levied on Workers field (initially set at zero dolla per hour) shifts the supply curve up by the amount you enter. To determine the before-tax wage for each tax proposal, adjust the amount in the Wage field until the quantity of labor supplied equals the quantity of labor demanded. You will not be graded on any changes you make to this graph Note: Once you enter a value in a white field, the graph and any corresponding amounts in each grey field will change accordingly. Graph Input Tool Market for Research Assistants 20 18 I Wage (Dollars per hour) 4 Supply 16 Labor Demanded (Number of workers) Labor Supplied (Number of workers) 14 248 152 12 10 Demand Shifter Supply Shifter Tax Levied on Employers (Dollars per hour) Tax Levied on Workers (Dollars per hour) Dem and 14 40 80 120 100 200 240 280 320 360 400 LABOR (Number of workers) WAGE (Dollars per hour)

Principles of Economics 2e
2nd Edition
ISBN:9781947172364
Author:Steven A. Greenlaw; David Shapiro
Publisher:Steven A. Greenlaw; David Shapiro
Chapter4: Labor And Financial Markets
Section: Chapter Questions
Problem 21CTQ: Other than the demand for labor, what would be another example of a 'derived demand?

Related questions
Question
100%
Transcribed Image Text:Use the graph input tool to evaluate these three o S Entering a number into the Tax Levied on Employers feid (incaly set at aenvae 23 DE
Homework (Ch 06)
The following graph shows the labor market for research assistants in the fictional country of Academia. The equilibrium wage is $10 per hour, and the
equilibrium number of research assistants is 200.
Suppose the government has decided to institute a $4-per-hour payroll tax on research assistants and is trying to determine whether the tax should
be levied on the employer, the workers, or both (such that half the tax is collected from each side).
Use the graph input tool to evaluate these three proposals. Entering a number into the Tax Levied on Employers field (initially set at zero dollars per
hour) shifts the demand curve down by the amount you enter, and entering a number into the Tax Levied on Workers field (initially set at zero dollars
per hour) shifts the supply curve up by the amount you enter. To determine the before-tax wage for each tax proposal, adjust the amount in the
Wage field until the quantity of labor supplied equals the quantity of labor demanded. You will not be graded on any changes you make to this graph.
Note: Once you enter a value in a white field, the graph and any corresponding amounts in each grey field will change accordingly.
Graph Input Tool
Market for Research Assistants
20
18
I Wage
(Dollars per hour)
4
18
Supply
Labor Demanded
(Number of workers)
Labor Supplied
(Number of workers)
14
248
152
10
Demand Shifter
Supply Shifter
Таx Levied on
Employers
(Dollars per hour)
Tax Levied on
Workers
(Dollars per hour)
Demand
40
80
120 180 200 240 280 320 360 400
LABOR (Number of workers)
WAGE (Dollars per hour)
12
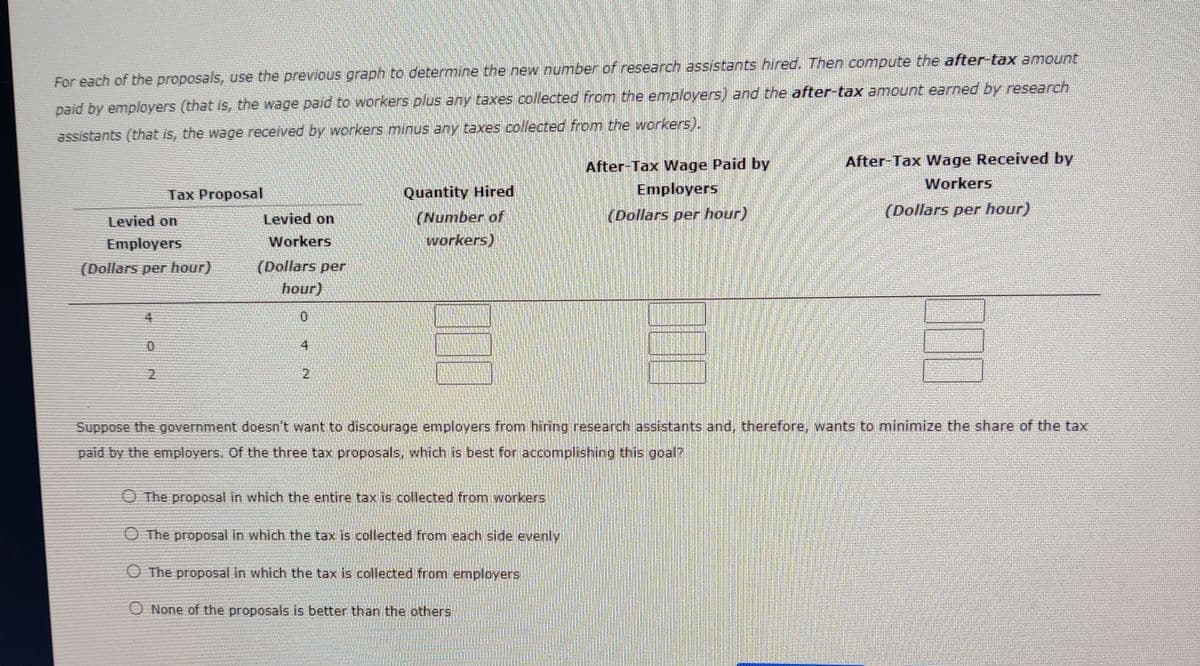
Transcribed Image Text:For each of the proposals, use the previous graph to determine the new number of research assistants hired. Then compute the after-tax amount
paid by employers (that is, the wage paid to workers plus any taxes collected from the employers) and the after-tax amount earned by research
assistants (that is, the wage received by workers minus any taxes collected from the workers).
After-Tax Wage Paid by
After-Tax Wage Received by
Workers
Employers
Quantity Hired
(Number of
workers)
Тах Ргoposal
(Dollars per hour)
(Dollars per hour)
Levied on
Levied on
Employers
Workers
(Dollars per
hour)
(Dollars per hour)
4
2
Suppose the government doesn't want to discourage employers from hiring research assistants and, therefore, wants to minimize the share of the tax
paid by the employers. Of the three tax proposals, which is best for accomplishing this goal?
O The proposal in which the entire tax is collected from workers
O The proposal in which the tax is collected from each side evenly
O The proposal in which the tax is collected from employers
O None of the proposals is better than the others
Expert Solution
This question has been solved!
Explore an expertly crafted, step-by-step solution for a thorough understanding of key concepts.

This is a popular solution!

Trending now
This is a popular solution!

Step by step
Solved in 3 steps with 5 images

Knowledge Booster


Learn more about
Need a deep-dive on the concept behind this application? Look no further. Learn more about this topic, economics and related others by exploring similar questions and additional content below.Recommended textbooks for you
Principles of Economics 2e
Economics
ISBN:
9781947172364
Author:
Steven A. Greenlaw; David Shapiro
Publisher:
OpenStax
Principles of Economics 2e
Economics
ISBN:
9781947172364
Author:
Steven A. Greenlaw; David Shapiro
Publisher:
OpenStax