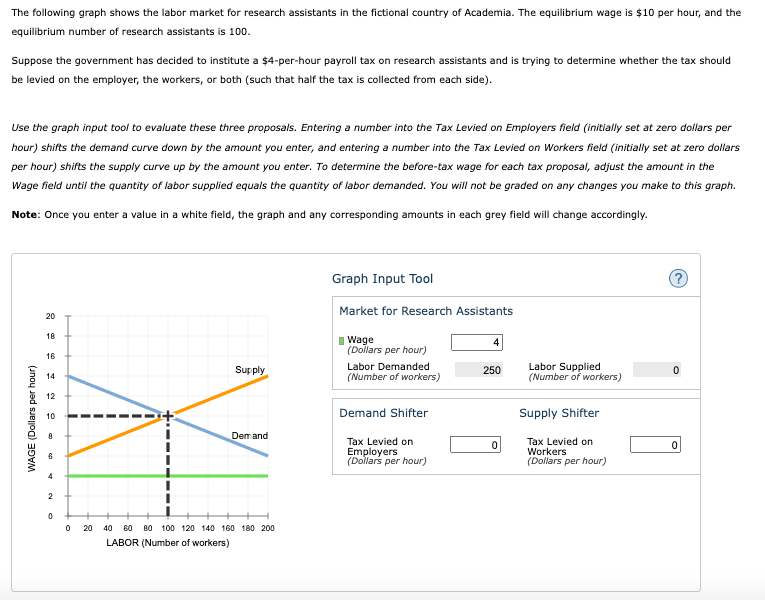
The following graph shows the labor market for research assistants in the fictional country of Academia. The equilibrium wage is $10 per hour, and the equilibrium number of research assistants is 100. Suppose the government has decided to institute a $4-per-hour payroll tax on research assistants and is trying to determine whether the tax should be levied on the employer, the workers, or both (such that half the tax is collected from each side). Use the graph input tool to evaluate these three proposals. Entering a number into the Tax Levied on Employers field (initially set at zero dollars per hour) shifts the demand curve down by the amount you enter, and entering a number into the Tax Levied on Workers field (initially set at zero dollars per hour) shifts the supply curve up by the amount you enter. To determine the before-tax wage for each tax proposal, adjust the amount in the Wage field until the quantity of labor supplied equals the quantity of labor demanded. You will not be graded on any changes you make to this graph. Note: Once you enter a value in a white field, the graph and any corresponding amounts in each grey field will change accordingly. Graph Input Tool Market for Research Assistants 20 18 I Wage (Dollars per hour) 16 Supply Labor Demanded (Number of workers) Labor Supplied (Number of workers) 250 14 12 Demand Shifter Supply Shifter 10 Dem and Tax Levied on Employers (Dollars per hour) Tax Levied Workers (Dollars per hour) O 20 40 60 80 100 120 140 160 180 200 LABOR (Number of workers) WAGE (Dollars per hour)
The following graph shows the labor market for research assistants in the fictional country of Academia. The equilibrium wage is $10 per hour, and the equilibrium number of research assistants is 100. Suppose the government has decided to institute a $4-per-hour payroll tax on research assistants and is trying to determine whether the tax should be levied on the employer, the workers, or both (such that half the tax is collected from each side). Use the graph input tool to evaluate these three proposals. Entering a number into the Tax Levied on Employers field (initially set at zero dollars per hour) shifts the demand curve down by the amount you enter, and entering a number into the Tax Levied on Workers field (initially set at zero dollars per hour) shifts the supply curve up by the amount you enter. To determine the before-tax wage for each tax proposal, adjust the amount in the Wage field until the quantity of labor supplied equals the quantity of labor demanded. You will not be graded on any changes you make to this graph. Note: Once you enter a value in a white field, the graph and any corresponding amounts in each grey field will change accordingly. Graph Input Tool Market for Research Assistants 20 18 I Wage (Dollars per hour) 16 Supply Labor Demanded (Number of workers) Labor Supplied (Number of workers) 250 14 12 Demand Shifter Supply Shifter 10 Dem and Tax Levied on Employers (Dollars per hour) Tax Levied Workers (Dollars per hour) O 20 40 60 80 100 120 140 160 180 200 LABOR (Number of workers) WAGE (Dollars per hour)

Microeconomics: Private and Public Choice (MindTap Course List)
16th Edition
ISBN:9781305506893
Author:James D. Gwartney, Richard L. Stroup, Russell S. Sobel, David A. Macpherson
Publisher:James D. Gwartney, Richard L. Stroup, Russell S. Sobel, David A. Macpherson
Chapter12: The Supply Of And Demand For Productive Resources
Section: Chapter Questions
Problem 7CQ

Related questions
Question
Transcribed Image Text:The following graph shows the labor market for research assistants in the fictional country of Academia. The equilibrium wage is $10 per hour, and the
equilibrium number of research assistants is 100.
Suppose the government has decided to institute a $4-per-hour payroll tax on research assistants and is trying to determine whether the tax should
be levied on the employer, the workers, or both (such that half the tax is collected from each side).
Use the graph input tool to evaluate these three proposals. Entering a number into the Tax Levied on Employers field (initially set at zero dollars per
hour) shifts the demand curve down by the amount you enter, and entering a number into the Tax Levied on Workers field (initially set at zero dollars
per hour) shifts the supply curve up by the amount you enter. To determine the before-tax wage for each tax proposal, adjust the amount in the
Wage field until the quantity of labor supplied equals the quantity of labor demanded. You will not be graded on any changes you make to this graph.
Note: Once you enter a value in a white field, the graph and any corresponding amounts in each grey field will change accordingly.
Graph Input Tool
Market for Research Assistants
20
18
I Wage
(Dollars per hour)
4
16
Labor Demanded
Labor Supplied
(Number of workers)
Supply
250
14
(Number of workers)
12
Demand Shifter
Supply Shifter
10
Demand
Tax Levied on
Employers
(Dollars per hour)
Tax Levied on
Workers
(Dollars per hour)
20
40
60
80 100 120 140 160 180 200
LABOR (Number of workers)
WAGE (Dollars per hour)
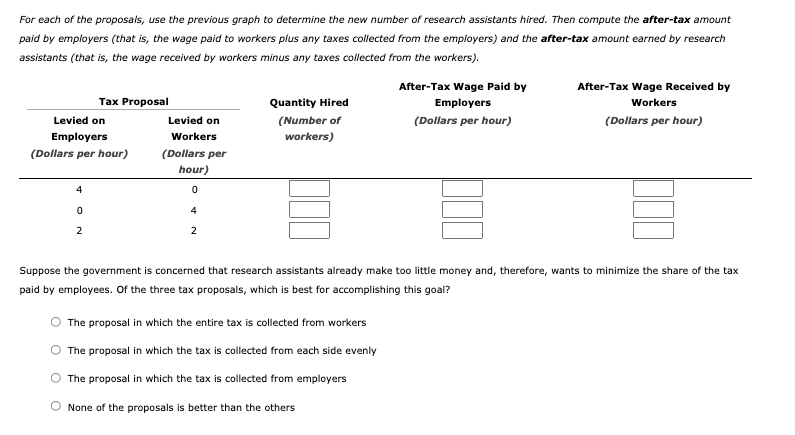
Transcribed Image Text:For each of the proposals, use the previous graph to determine the new number of research assistants hired. Then compute the after-tax amount
paid by employers (that is, the wage paid to workers plus any taxes collected from the employers) and the after-tax amount earned by research
assistants (that is, the wage received by workers minus any taxes collected from the workers).
After-Tax Wage Paid by
After-Tax Wage Received by
Tax Proposal
Quantity Hired
Employers
Workers
Levied on
Levied on
(Number of
(Dollars per hour)
(Dollars per hour)
Employers
Workers
workers)
(Dollars per hour)
(Dollars per
hour)
4
4
2
2
Suppose the government is concerned that research assistants already make too little money and, therefore, wants to minimize the share of the tax
paid by employees. Of the three tax proposals, which is best for accomplishing this goal?
The proposal in which the entire tax is collected from workers
The proposal in which the tax is collected from each side evenly
The proposal in which the tax is collected from employers
None of the proposals is better than the others
Expert Solution
This question has been solved!
Explore an expertly crafted, step-by-step solution for a thorough understanding of key concepts.

This is a popular solution!

Trending now
This is a popular solution!

Step by step
Solved in 2 steps

Knowledge Booster


Learn more about
Need a deep-dive on the concept behind this application? Look no further. Learn more about this topic, economics and related others by exploring similar questions and additional content below.Recommended textbooks for you
Microeconomics: Private and Public Choice (MindTa…
Economics
ISBN:
9781305506893
Author:
James D. Gwartney, Richard L. Stroup, Russell S. Sobel, David A. Macpherson
Publisher:
Cengage Learning

Economics: Private and Public Choice (MindTap Cou…
Economics
ISBN:
9781305506725
Author:
James D. Gwartney, Richard L. Stroup, Russell S. Sobel, David A. Macpherson
Publisher:
Cengage Learning

Microeconomics: Private and Public Choice (MindTa…
Economics
ISBN:
9781305506893
Author:
James D. Gwartney, Richard L. Stroup, Russell S. Sobel, David A. Macpherson
Publisher:
Cengage Learning
Economics: Private and Public Choice (MindTap Cou…
Economics
ISBN:
9781305506725
Author:
James D. Gwartney, Richard L. Stroup, Russell S. Sobel, David A. Macpherson
Publisher:
Cengage Learning