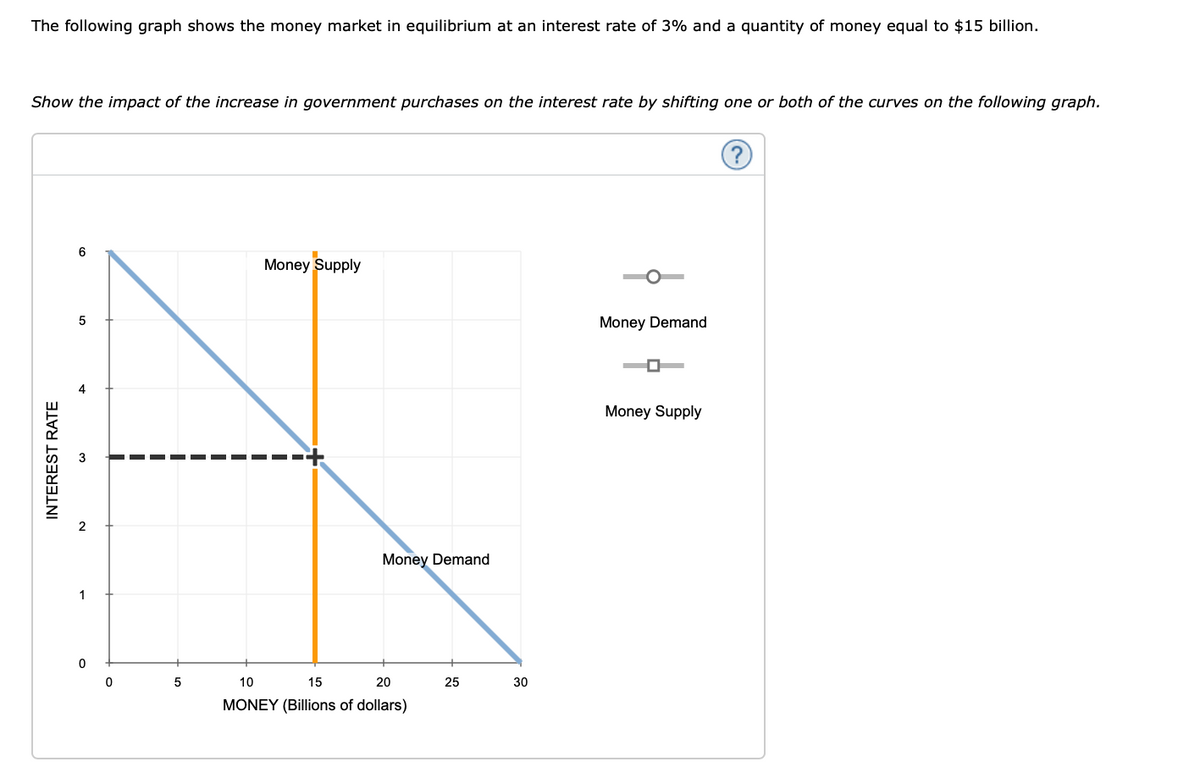
The following graph shows the money market in equilibrium at an interest rate of 3% and a quantity of money equal to $15 billion. Show the impact of the increase in government purchases on the interest rate by shifting one or both of the curves on the following graph. 6 Money Supply 5 Money Demand Money Supply Money Demand 1 5 10 15 20 25 30 MONEY (Billions of dollars) INTEREST RATE


Q: Refer to the graph. If the initial equilibrium interest rate was 5 percent and the money supply…
A: Given: Equilibrium Interest Rate is 5%. In the diagram, only money demand curve is given.…
Q: Refer to the graph. If the initial equilibrium interest rate was 5 percent and the money supply…
A: Equilibrium interest is determined by the intersection of money supply and money demand curve. And…
Q: 2.1 Does the money demand curve have a positive slope or a negative slope? Why does it have this…
A: The demand curve for the most part inclines descending from left to right. It has a negative slant…
Q: Fill in the Value of Money column in the following table. Quantity of Money Demanded (Billions of…
A: Price level (P) Value of money (= 1 / P) Money Demanded 1 1 1.5 1.33 0.75 2 2 0.5 3.5 4 0.25…
Q: Interest-The Money Market Exercise 2 The table below depicts transaction demand for money (D and…
A: Demand for money is a downward sloping function of the interest rate while supply of money is an…
Q: The figure shows the demand for money curve in Epsilon. The Fed wants the interest rate to be 6…
A: The o
Q: The following graph represents the money market in a hypothetical economy. As in the United States,…
A: Fed is the central bank of United States which controls the supply of money in the economy.
Q: Discuss the importance of monetary base to the overall money supply.
A: Money supply includes all of the liquidated instruments along with currency in form of deposits and…
Q: Using the table below, answer the questions below about the market for money: Nominal Interest Rate…
A: Meaning of Money Supply: The term money supply refers to the situation under which the overall…
Q: 1. For each of the following questions, draw the Money Demand curve (MD) and Money Supply curve (MS)…
A: 1. a) The Fed raises the discount rate : Fed raising the discount rate is known as a contractionary…
Q: he following diagram represents the equilibrium in the money market. Explain the following question…
A: It's crucial to understand that money is not the same as income or wealth. Demand for money has a…
Q: Suppose that the money supply is constant in Country A. Graphically illustrate and explain what…
A: The money supply is the stock of money in the economy. In other words, it is the total amount of…
Q: 1. Suppose that the money market can be depicted in the graph below Interest rate (M/P)2 (M/P)⁰…
A: The federal reserve Conducts the country's financial strategy by affecting cash and credit…
Q: Assume that the reserve requirement ratio is 12 percent and that the Fed uses open market operations…
A: Answer: Reserve requirement ratio= 12% or 0.12 Increase in monetary base=$200 million To calculate…
Q: Which of the following lists two things that both increase the money supply? a. The Fed buys bonds…
A: The correct option is b.
Q: the three federal tools of monetary control and how to apply to increase the money supply
A: Monetary policy: The Fed uses monetary policy to affect the amount of money in the economy. This…
Q: The following graph shows the money market in a hypothetical economy. The central bank in this…
A: Aggregate demand is a term utilized in macroeconomics to depict the all-out demand for merchandise…
Q: The asset demand for money 'Da' is shown in the graph below. The transactions demand for money is…
A:
Q: The IS curve represents A. the single level of output where the goods market is in equilibrium. B.…
A: “Since you have asked multiple questions, we will solve the first question for you. If you want any…
Q: Suppose that the following equations describe goods and money market equilibrium (symbols are as…
A: IS curve depicts the combination of interest rate and equilibrium output which clears the goods…
Q: 1dea FIll in the Value of Money column in the following table. Quantity of Money Demanded Price…
A: Given below is the table which gives the value of money at each price level of Price level…
Q: What happens to the amount of money demanded or supplied in each of the following cases? Draw a…
A: Money can either be saved, spent or invested. "Money supply refers to the total amount of money…
Q: Suppose that, initially, the economy is operating in an inflationary gap and that the Federal…
A: An inflationary gap results from the economy producing more that its potential output.…
Q: 8. Refer to Figure 1. At an interest rate of 8%, there is: a) excess demand for money and the…
A: An equilibrium in money market is attained at that rate of interest where Demand for Money is equal…
Q: The above figure has the demand for money curve. Suppose the Fed initially sets the quantity of…
A: since you have asked multiple questions, according to our policy we will solve the first question.…
Q: Use the quantity equation to answer the following: 1. What is the velocity of money when the price…
A: The quantity theory of money says that the price level of goods and services in an economy is…
Q: Figure 1: MS Interest Rate (%) 5% MD 150 Money (S million) 21. Refer to Figure 1. At an interest…
A: Meaning of Money Supply: The term money supply refers to the situation under which the overall…
Q: 7. Economic commentators have pointed out that demand for money in a developed country is projected…
A: Money Demand: - The demand for money is the individual's desire to keep their assets in the form of…
Q: The following graph shows an increase in the demand for money from 2013 (MD2013) to 2014 (MD2014)…
A: Why there is a need to decrease the money supply? In long run, a fall in money supply is to check…
Q: u10. Using the demand and supply schedule for money shown below, do the following: a)Graph the…
A: The LM curve shows the relation between the interest rate and the quantity of money which is…
Q: The Washington Post has reported that “The Fed’s broadest measure of the money supply, is more than…
A: The Federal Reserve (Fed) is the source of money in the money market. The Federal Reserve has the…
Q: Currently, the money market is at the equilibrium with the interest rate at the Fed’s target level.…
A:
Q: Show the impact of the increase in government purchases on the interest rate by shifting one or both…
A: The increase in the government expenditure will shift the market demand rightward. The demand for…
Q: briefly explain the three specific funtions of money that economists identified
A: Main three primary function of money are - 1) medium of exchange - this is the most important…
Q: 1. For each of the following questions, draw the Money Demand curve (MD) and Money Supply curve (MS)…
A: Since you have posted a question with multiple sub-parts, we will solve the first three sub-parts…
Q: (Figure: A Money Market) The accompanying figure Equilibrium in the Money Market shows the money…
A: Monetary policy: Monetary policy is the tool in the hands of the central bank of a country which…
Q: the situation below with appropriate graph. a)The Fed buys purchase government securities in open…
A: When fed purchase securities under open market operations, the fed is engaged in expansionary…
Q: The following table shows a money demand schedule, which is the quantity of money demanded at…
A: Part A) Value of money is = 1/Price level(P). By using this equation, the table can be re-drawn as:…
Q: The following graph represents the money market in a hypothetical economy. As in the United States,…
A: When the central bank decides to increase the target interest rate, it implements a contractionary…
Q: The following graph represents the money market in a hypothetical economy. As in the United States,…
A: Aggregate supply is the total quantity of output firms will produce and sell—in other words, the…
Q: The following graph shows the money market in a hypothetical economy. The central bank in this…
A: If the price level increases, the people require more money for buying and selling of products and…
Q: Suppose that for each one-percentage-point increase in the interest rate, the level of investment…
A: Given, MPC (marginal propensity to consume) = 0.5 MPS (marginal propensity to save) = 0.5
Q: Suppose following a 25% increase in the monetary base, the money supply rises by 80%. The simple…
A: Money supplier: It describes that how many times the money in the form of a loan has been…
Q: Show the impact of the increase in government purchases on the interest rate by shifting one or both…
A: Since you have asked multiple questions, we will solve the first question for you. If you want any…
What shifts on the graph provided?


Trending now
This is a popular solution!

Step by step
Solved in 2 steps with 1 images


- The following table shows a money demand schedule, which is the quantity of money demanded at various price levels ( P ).Fill in the Value of Money column in the following table.Price Level (P) Value of Money (1/P) Quantity of Money Demanded (Billions of dollars)1.00 ______ 1.51.33 _______2.02.00 _______3.54.00 _______ 7.0Now consider the relationship between the price level and the quantity of money that people demand. The lower the price level, the money the typical transaction requires, and the money people will wish to hold in the form of currency or demand deposits.Assume that the Fed initially fixes the quantity of money supplied at $3.5 billion.Use the orange line (square symbol) to plot the initial money supply ( MS1 ) set by the Fed. Then, referring to the previous table, use the blue connected points (circle symbol) to graph the money demand curve.When a consumer withdraws cash from a drawer in his house and deposits it in a savings account, the composition of the money supply immediately changes, and the size of the money supply may eventually alter as well. Demonstrate and explain how this activity may affect the money supply in an economy.Suppose that expanded credit card availability makes people demand less money at every value of money. a) Using the graph of the money market, show and explain how this change will impact the equilibrium value of money and the equilibrium price level in the economy (do not forget to label the axes). Using the graph of the money market, show and explain the action the Federal Reserve could take to return the economy to its initial price level.
- Answer the question based on the following information: For transactions, households and businesses want to hold an amount of money equal to one-half of nominal GDP. The table shows the amounts of money they want to hold as an asset at various interest rates. If nominal GDP is $300 and the supply of money is $250, the equilibrium interest rate will be Interest Rate Amount of Money Demanded as an Asset 10% $20 8 40 6 60 4 80 2 100 Multiple Choice 4 percent. 10 percent. 6 percent. 8 percent. 2 percent.The following graph shows the money market in equilibrium at an interest rate of 6% and a quantity of money equal to $45 billion. Show the impact of the increase in government purchases on the interest rate by shifting one or both of the curves on the following graph.The following diagram represents the equilibrium in the money market. Explain the following question with the help of the graph ( in the picture ): a) What is the equilibrium level of interest rate and quantity of money demanded and supplied? b) What would happen in the money market if the market prevailing interest rate is 8? Describe the adjustment mechanism? c) How price level affects the money demand curve? How could you reflect this change diagrammatically? d) Why the Money supply curve is vertical and independent of the interest rate? Explain? e) Suppose central bank of Bangladesh decided to use open market sale of securities. How does it affect the money supply of the economy? Explain with graph?
- Money supply, money demand, and adjustment to monetary equilibrium The following table shows a money demand schedule, which is the quantity of money demanded at various price levels (P) Fill in the Value of Money column in the following table. Price Level (P) Value of Money (1/P) Quantity of Money Demanded (Billions of dollars) 1.00 0.50 / 1.00/2.00 1.5 1.33 0.67 / 0.75 / 1.33 / 2.66 2.0 2.00 0.50 / 1.00/2.00/4.00 3.5 4.00 0.25 / 2.00/4.00/8.00 7.0 Now consider the relationship between the price level and the quantity of money that people demand. The lower the price level, the ___More/Less___money the typical transaction requires, and the___More/Less___money people will wish to hold in the form of currency or demand deposits. According to your graph, the equilibrium value of money is__0.25 / 0.50 /0.75 /1.00__ , therefore the equilibrium price level is __1.00 / 1.33 / 2.00 / 4.00__ . Now, suppose that the Fed increases…Equilibrium in the money market occurs when Select one: a. the transactions demand for money equals the precautionary demand for money. b. the quantity of money demanded is more than the quantity of money supplied in the economy. c. the quantity of money demanded equals the quantity of money supplied in the economy. d. the quantity of money demanded is less than the quantity of money supplied in the economy.The following table shows a money demand schedule, which is the quantity of money demanded at various price levels (PP). Fill in the Value of Money column in the following table. Price Level (P) Value of Money (1/P) Quantity of Money Demanded 1.00 1.5 1.33 2.0 2.00 3.5 4.00 7.0 Now consider the relationship between the price level and the quantity of money that people demand. The lower the price level, the (a. more, b. less) money the typical transaction requires, and the (a. more, b. less) money people will wish to hold in the form of currency or demand deposits. Assume that the Fed initially fixes the quantity of money supplied at $3.5 billion. Use the orange line (square symbol) to plot the initial money supply (MS1) set by the Fed. Then, referring to the previous table, use the blue connected points (circle symbol) to graph the money demand curve. (Graph in image) According to your graph, the equilibrium value of…
- #16 [MUST SHOW WORK] Suppose the Bank of Canada uses open market operations to raise the overnight rate. As a result the _____________. (Draw a graph to show your work.) Select one: A. demand for money decreases B. quantity of money supplied increases C. demand for money increases D. supply of money decreases E. supply of money increasesSuppose the money market for some hypothetical economy is given by the following graph, which plots the money demand and money supply curves. Assume the central bank in this economy (the Fed) fixes the quantity of money supplied. Suppose the price level increases from 90 to 105. Shift the appropriate curve on the graph to show the impact of an increase in the overall price level on the market for money. Following the price level increase, the quantity of money demanded at the initial interest rate of 6% will be (greater/less)than the quantity of money supplied by the Fed at this interest rate. As a result, individuals will attempt to (increase/decrease) their money holdings. In order to do so, they will (buy/sell) bonds and other interest-bearing assets, and bond issuers will realize that they (have to offer higher/can offer lower) interest rates until equilibrium is restored in the money market at an interest rate of ______%. The following graph plots the…Q8 Which of the following statements is consistent with a given (i.e., fixed) IS curve? Select one: a. A reduction in the interest rate causes money demand to decrease. b. A reduction in the interest rate causes investment spending to increase. c. An increase in government spending causes an increase in demand for goods. d. A reduction in the interest rate causes an increase in the money supply.

