The following graph shows the monthly demand and supply curves in the market for shirts. Use the graph input tool to help you answer the following questions. Enter an amount into the Price field to see the quantity demanded and quantity supplied at that price. You will not be graded on any changes you make to this graph. PRICE (Dollars per shirt) 8882 83 222 2 100 1 Supply Demand 1 I 0 50 100 150 200 250 300 350 400 450 500 QUANTITY (Shirts) Price (Dollars per shirt) 40 60 The equilibrium price in this market is $ shirts bought and sold per month. Graph Input Tool Shortage or Surplus Market for Shirts Price (Dollars per shirt) Quantity Demanded (Shirts) 20 310 Quantity Supplied (Shirts) Complete the following table by indicating at each price whether there is a shortage or surplus in the market, the amount of that shortage or surplus, and whether this places upward or downward pressure on prices. 190 per shirt, and the equilibrium quantity is Shortage or Surplus Amount (Shirts) Pressure
The following graph shows the monthly demand and supply curves in the market for shirts. Use the graph input tool to help you answer the following questions. Enter an amount into the Price field to see the quantity demanded and quantity supplied at that price. You will not be graded on any changes you make to this graph. PRICE (Dollars per shirt) 8882 83 222 2 100 1 Supply Demand 1 I 0 50 100 150 200 250 300 350 400 450 500 QUANTITY (Shirts) Price (Dollars per shirt) 40 60 The equilibrium price in this market is $ shirts bought and sold per month. Graph Input Tool Shortage or Surplus Market for Shirts Price (Dollars per shirt) Quantity Demanded (Shirts) 20 310 Quantity Supplied (Shirts) Complete the following table by indicating at each price whether there is a shortage or surplus in the market, the amount of that shortage or surplus, and whether this places upward or downward pressure on prices. 190 per shirt, and the equilibrium quantity is Shortage or Surplus Amount (Shirts) Pressure

Principles of Economics 2e
2nd Edition
ISBN:9781947172364
Author:Steven A. Greenlaw; David Shapiro
Publisher:Steven A. Greenlaw; David Shapiro
Chapter3: Demand And Supply
Section: Chapter Questions
Problem 55P: Table 3.9 illustrates the markets demand and supply for cheddar cheese. Graph the data and find the...

Related questions
Question
Confused and don’t know what steps to take to solve
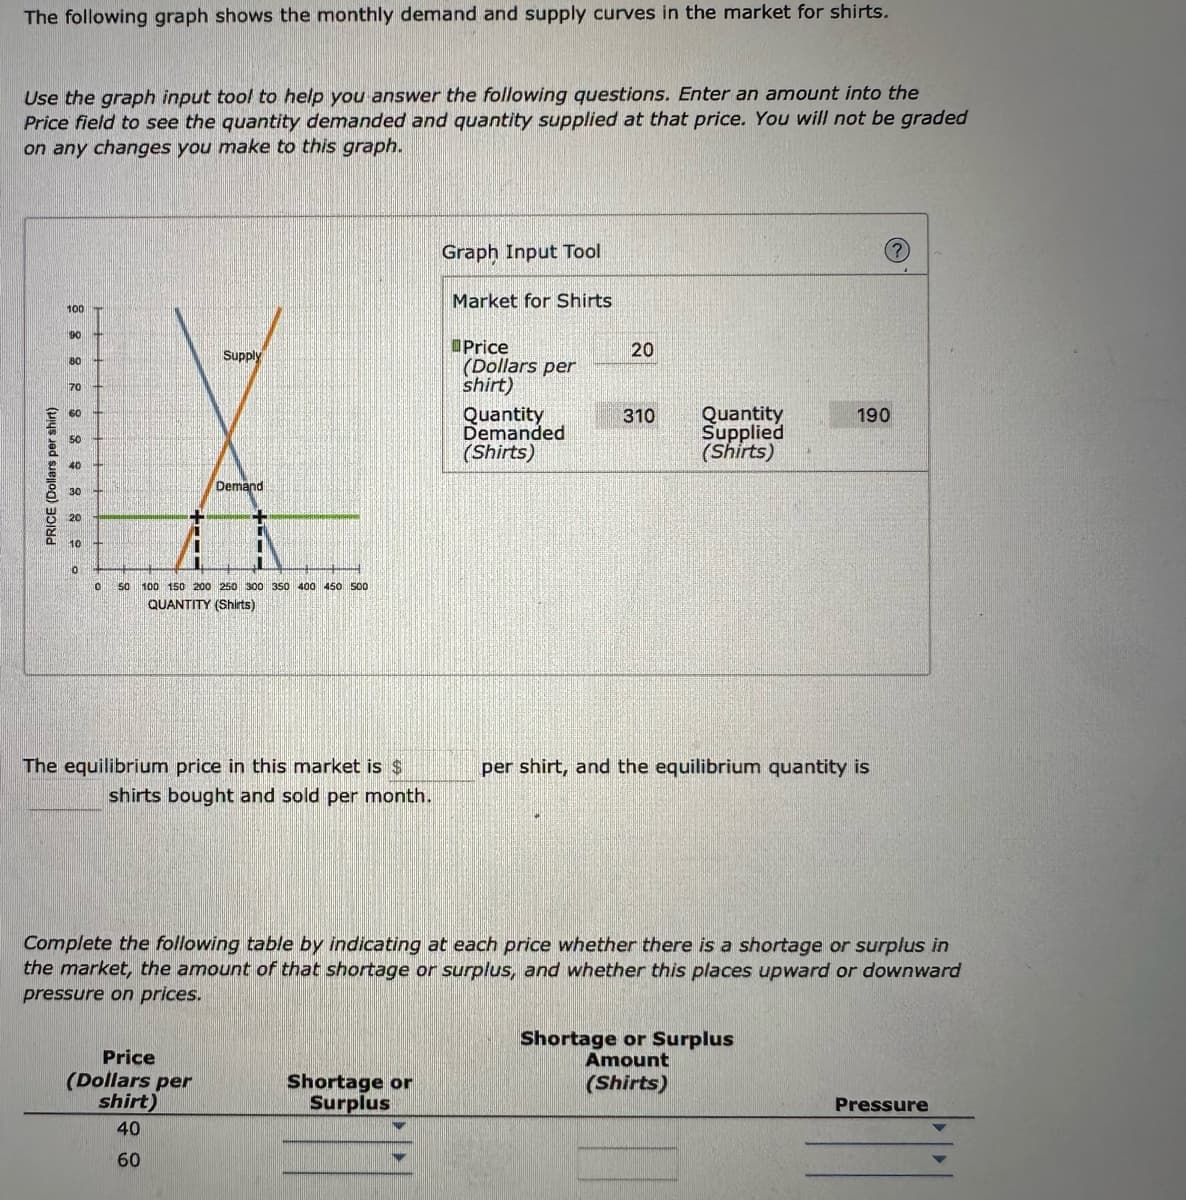
Transcribed Image Text:The following graph shows the monthly demand and supply curves in the market for shirts.
Use the graph input tool to help you answer the following questions. Enter an amount into the
Price field to see the quantity demanded and quantity supplied at that price. You will not be graded
on any changes you make to this graph.
PRICE (Dollars per shirt)
68% 882 88 8
100
50
Supply
Demand
U
0 50 100 150 200 250 300 350 400 450 500
QUANTITY (Shirts)
Price
(Dollars per
shirt)
40
60
The equilibrium price in this market is $
shirts bought and sold per month.
Graph Input Tool
Market for Shirts
Shortage or
Surplus
Price
(Dollars per
shirt)
Quantity
Demanded
(Shirts)
20
310
Quantity
Supplied
(Shirts)
per shirt, and the equilibrium quantity is
Complete the following table by indicating at each price whether there is a shortage or surplus in
the market, the amount of that shortage or surplus, and whether this places upward or downward
pressure on prices.
(?)
190
Shortage or Surplus
Amount
(Shirts)
Pressure
Expert Solution
Step 1
The demand and supply forces are the invisible forces that react in the economy and work according to the changes in the quantities demanded and supplied. The interaction points of both the forces act as the equilibrium point in the economy. The price and quantity at this point is market clearing.

Trending now
This is a popular solution!

Step by step
Solved in 3 steps

Knowledge Booster


Learn more about
Need a deep-dive on the concept behind this application? Look no further. Learn more about this topic, economics and related others by exploring similar questions and additional content below.Recommended textbooks for you
Principles of Economics 2e
Economics
ISBN:
9781947172364
Author:
Steven A. Greenlaw; David Shapiro
Publisher:
OpenStax

Microeconomics: Principles & Policy
Economics
ISBN:
9781337794992
Author:
William J. Baumol, Alan S. Blinder, John L. Solow
Publisher:
Cengage Learning

Economics (MindTap Course List)
Economics
ISBN:
9781337617383
Author:
Roger A. Arnold
Publisher:
Cengage Learning
Principles of Economics 2e
Economics
ISBN:
9781947172364
Author:
Steven A. Greenlaw; David Shapiro
Publisher:
OpenStax
Microeconomics: Principles & Policy
Economics
ISBN:
9781337794992
Author:
William J. Baumol, Alan S. Blinder, John L. Solow
Publisher:
Cengage Learning
Economics (MindTap Course List)
Economics
ISBN:
9781337617383
Author:
Roger A. Arnold
Publisher:
Cengage Learning


Exploring Economics
Economics
ISBN:
9781544336329
Author:
Robert L. Sexton
Publisher:
SAGE Publications, Inc
