the following graph, use the green point (triangle symbol) to plot the annual total revenue when the market price is $50, $75, $100, $125, 75, and $200 per bike. 10600 9800 Total Revenue 9000 8200 7400 6600 5800 5000 4200 3400 25 50 75 100 125 150 175 200 225 250 275 300 PRICE (Dollars per bike) cording to the midpoint method, the price elasticity of demand between points A and B is approximately ppose the price of bikes is currently $200 per bike, shown as point A on the initial graph. Because the demand between points A and B is , a $25-per-bike decrease in price will lead to in total revenue per day. general, in order for a price increase to cause a decrease in total revenue, demand must be
the following graph, use the green point (triangle symbol) to plot the annual total revenue when the market price is $50, $75, $100, $125, 75, and $200 per bike. 10600 9800 Total Revenue 9000 8200 7400 6600 5800 5000 4200 3400 25 50 75 100 125 150 175 200 225 250 275 300 PRICE (Dollars per bike) cording to the midpoint method, the price elasticity of demand between points A and B is approximately ppose the price of bikes is currently $200 per bike, shown as point A on the initial graph. Because the demand between points A and B is , a $25-per-bike decrease in price will lead to in total revenue per day. general, in order for a price increase to cause a decrease in total revenue, demand must be

Chapter18: Asymmetric Information
Section: Chapter Questions
Problem 18.3P

Related questions
Question
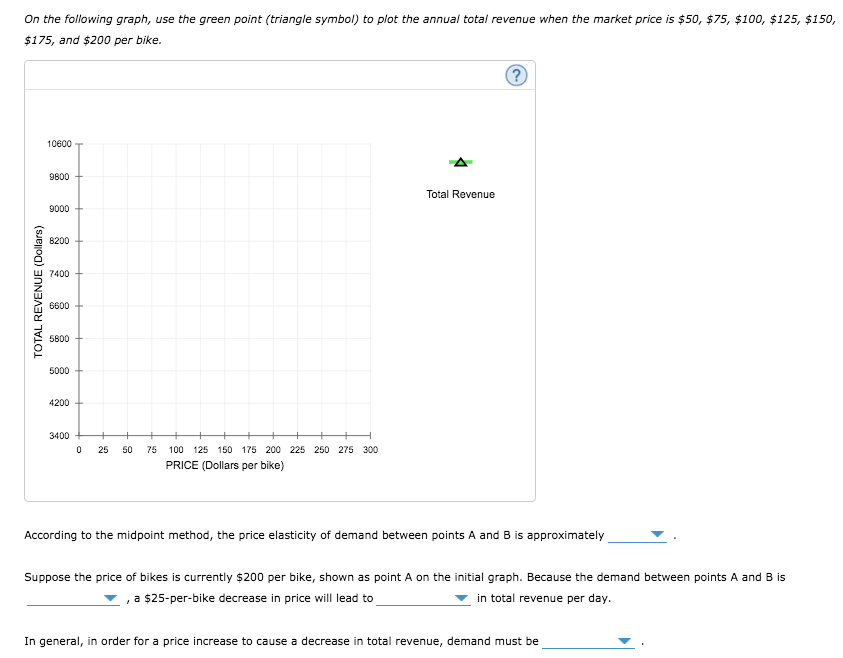
Transcribed Image Text:On the following graph, use the green point (triangle symbol) to plot the annual total revenue when the market price is $50, $75, $100, $125, $150,
$175, and $200 per bike.
10600
9800
Total Revenue
9000
8200
7400
6600
5800
5000
4200
3400
25
50
75
100 125 150 175 200 225 250 275 300
PRICE (Dollars per bike)
According to the midpoint method, the price elasticity of demand between points A and B is approximately
Suppose the price of bikes is currently $200 per bike, shown as point A on the initial graph. Because the demand between points A and B is
, a $25-per-bike decrease in price will lead to
in total revenue per day.
In general, in order for a price increase to cause a decrease in total revenue, demand must be
TOTAL REVENUE (Dollars)
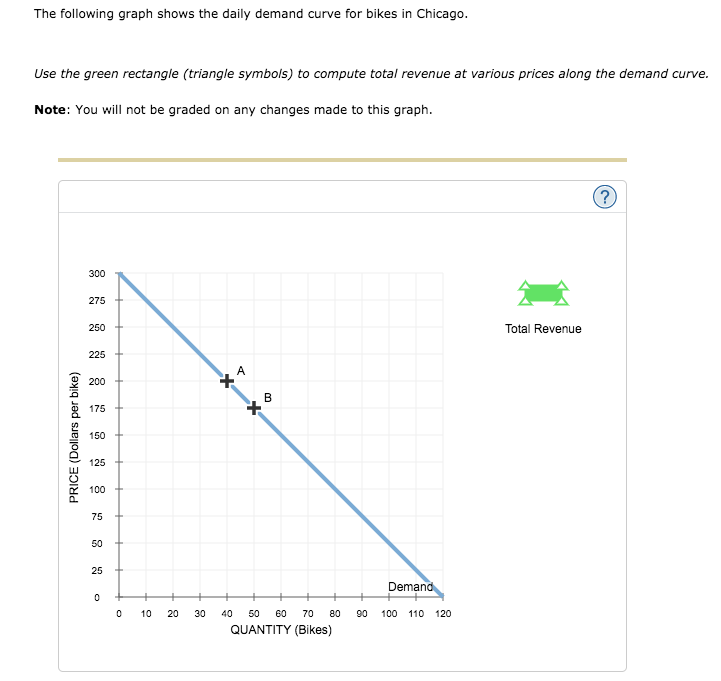
Transcribed Image Text:The following graph shows the daily demand curve for bikes in Chicago.
Use the green rectangle (triangle symbols) to compute total revenue at various prices along the demand curve.
Note: You will not be graded on any changes made to this graph.
(?
300
275
250
Total Revenue
225
200
+
В
175
150
125
100
75
50
25
Demand
10
20
30
40
50
60
70
80
90
100
110 120
QUANTITY (Bikes)
PRICE (Dollars per bike)
Expert Solution
This question has been solved!
Explore an expertly crafted, step-by-step solution for a thorough understanding of key concepts.

This is a popular solution!

Trending now
This is a popular solution!

Step by step
Solved in 4 steps with 3 images

Recommended textbooks for you