The following Histogram represents the SAT scores of a sample of students. 7. 145 «Cbsses» 95 195 245> What is the class width? 06 010 05 04 035 What is the scale of measurement Onominal scale. Ointerval scale. Oratio scale. Oordinal scale. What is the percentage of students whose grades are between 9 and 20? 037.14% 03.25% 071.42% 045% abouanbang n
The following Histogram represents the SAT scores of a sample of students. 7. 145 «Cbsses» 95 195 245> What is the class width? 06 010 05 04 035 What is the scale of measurement Onominal scale. Ointerval scale. Oratio scale. Oordinal scale. What is the percentage of students whose grades are between 9 and 20? 037.14% 03.25% 071.42% 045% abouanbang n

Mathematics For Machine Technology
8th Edition
ISBN:9781337798310
Author:Peterson, John.
Publisher:Peterson, John.
Chapter29: Tolerance, Clearance, And Interference
Section: Chapter Questions
Problem 16A: Spacers are manufactured to the mean dimension and tolerance shown in Figure 29-12. An inspector...

Related questions

Topic Video
Question
100%
may i know the correct answer for these qs?
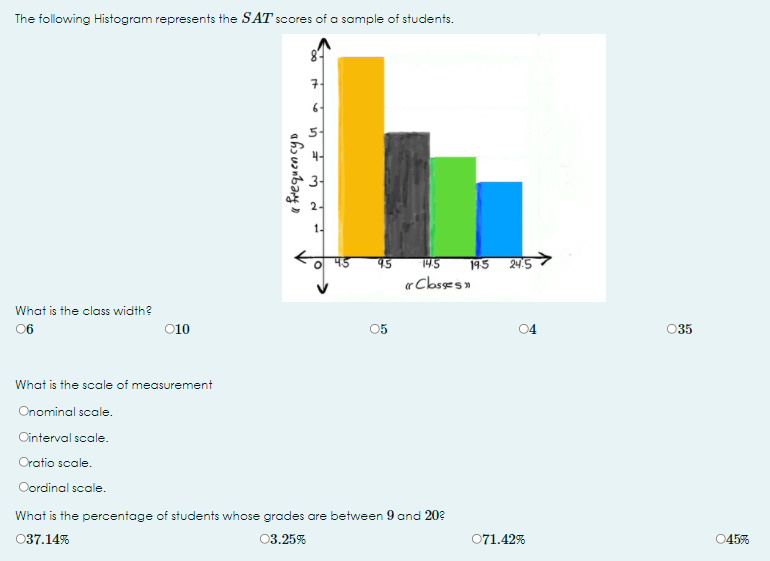
Transcribed Image Text:The following Histogram represents the SAT scores of a sample of students.
95
145
195
24.5
«Clbsses»
What is the class width?
06
010
05
04
035
What is the scale of measurement
Onominal scale.
Ointerval scale.
Oratio scale.
Oordinal scale.
What is the percentage of students whose grades are between 9 and 20?
037.14%
03.25%
071.42%
045%
1.
abɔuanbang »
Expert Solution
This question has been solved!
Explore an expertly crafted, step-by-step solution for a thorough understanding of key concepts.

Step by step
Solved in 3 steps with 2 images

Knowledge Booster


Learn more about
Need a deep-dive on the concept behind this application? Look no further. Learn more about this topic, statistics and related others by exploring similar questions and additional content below.Recommended textbooks for you
Mathematics For Machine Technology
Advanced Math
ISBN:
9781337798310
Author:
Peterson, John.
Publisher:
Cengage Learning,
Mathematics For Machine Technology
Advanced Math
ISBN:
9781337798310
Author:
Peterson, John.
Publisher:
Cengage Learning,