The following hypothetical production possibilities tables are for China and the United States. Assume that before specialization and trade the optimal product mix for China is alternative B and for the United States is alternative U. China Production Possibilities Product A E Apparel Chemicals (tons) 120,000 96,000 72,000 48,000 24,000 24 48 72 96 120 U.S. Production Possibilities Product R V W
The following hypothetical production possibilities tables are for China and the United States. Assume that before specialization and trade the optimal product mix for China is alternative B and for the United States is alternative U. China Production Possibilities Product A E Apparel Chemicals (tons) 120,000 96,000 72,000 48,000 24,000 24 48 72 96 120 U.S. Production Possibilities Product R V W

Principles of Economics 2e
2nd Edition
ISBN:9781947172364
Author:Steven A. Greenlaw; David Shapiro
Publisher:Steven A. Greenlaw; David Shapiro
Chapter33: International Trade
Section: Chapter Questions
Problem 31P: Review the numbers for Canada and Venezuela from Table 33.12 which describes how many barrels of oil...

Related questions
Question
Just need B
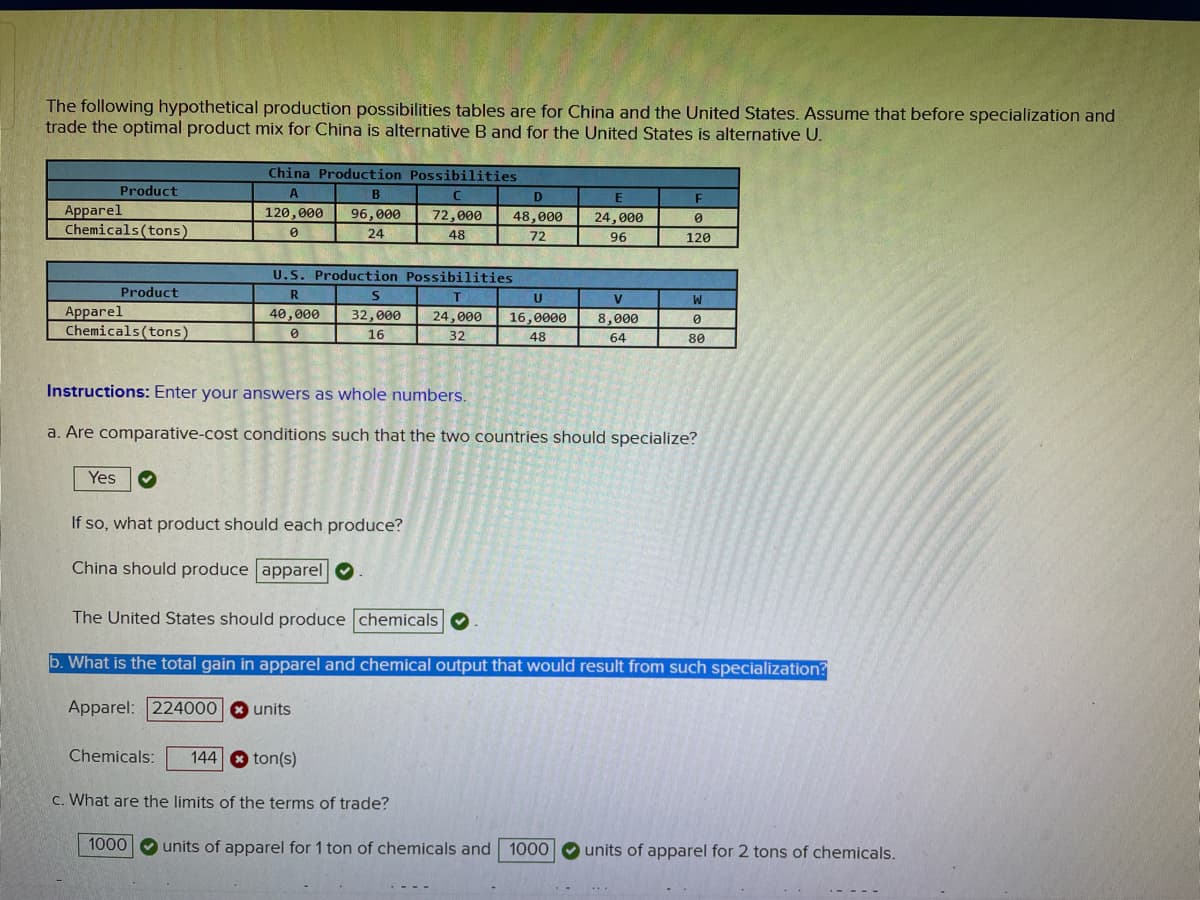
Transcribed Image Text:The following hypothetical production possibilities tables are for China and the United States. Assume that before specialization and
trade the optimal product mix for China is alternative B and for the United States is alternative U.
China Production Possibilities
Product
A
Apparel
Chemicals (tons)
120,000
96,000
72,000
48,000
24,000
24
48
72
96
120
U.S. Production Possibilities
Product
R.
W
Apparel
Chemicals(tons)
40,000
32,000
24,000
16,0000
8,000
16
32
48
64
80
Instructions: Enter your answers as whole numbers.
a. Are comparative-cost conditions such that the two countries should specialize?
Yes
If so, what product should each produce?
China should produce apparel O
The United States should produce chemicals
b. What is the total gain in apparel and chemical output that would result from such specialization?
Apparel: 224000 8 units
Chemicals:
144 8 ton(s)
c. What are the limits of the terms of trade?
1000 O units of apparel for 1 ton of chemicals and
1000 O units of apparel for 2 tons of chemicals.
Expert Solution
This question has been solved!
Explore an expertly crafted, step-by-step solution for a thorough understanding of key concepts.

This is a popular solution!

Trending now
This is a popular solution!

Step by step
Solved in 3 steps

Knowledge Booster


Learn more about
Need a deep-dive on the concept behind this application? Look no further. Learn more about this topic, economics and related others by exploring similar questions and additional content below.Recommended textbooks for you
Principles of Economics 2e
Economics
ISBN:
9781947172364
Author:
Steven A. Greenlaw; David Shapiro
Publisher:
OpenStax
Principles of Economics 2e
Economics
ISBN:
9781947172364
Author:
Steven A. Greenlaw; David Shapiro
Publisher:
OpenStax