You have the following data Yield Strength Threshold Stress 635 644 711 708 836 820 810 870 856 923 878 937 948 100 93 88 84 77 75 74 63 57 55 | 47| 43 38 a. Eyeball the data. Does the correlation between x and y look positive, negative or close to 0? What does it mean if it is significantly close or away from 0? b. Find the mean and standard deviations of x & y as well as the correlation (you can use a calculator or computer). c. Build a linear regression line. d. Plot a histogram of the residuals. What value do you get for the standard error of the residuals? How does that number relate to your histogram? e. Build a 95% confidence interval for your slope.
You have the following data Yield Strength Threshold Stress 635 644 711 708 836 820 810 870 856 923 878 937 948 100 93 88 84 77 75 74 63 57 55 | 47| 43 38 a. Eyeball the data. Does the correlation between x and y look positive, negative or close to 0? What does it mean if it is significantly close or away from 0? b. Find the mean and standard deviations of x & y as well as the correlation (you can use a calculator or computer). c. Build a linear regression line. d. Plot a histogram of the residuals. What value do you get for the standard error of the residuals? How does that number relate to your histogram? e. Build a 95% confidence interval for your slope.

Glencoe Algebra 1, Student Edition, 9780079039897, 0079039898, 2018
18th Edition
ISBN:9780079039897
Author:Carter
Publisher:Carter
Chapter4: Equations Of Linear Functions
Section4.5: Correlation And Causation
Problem 2BGP

Related questions
Question
Please provide solution and logic for questions attached, thanks!
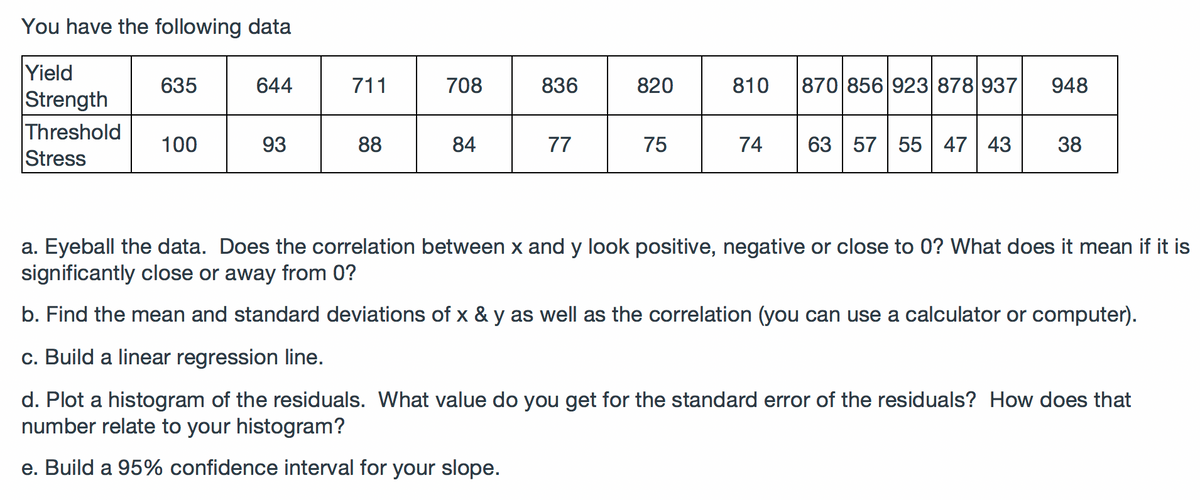
Transcribed Image Text:You have the following data
Yield
Strength
Threshold
Stress
635
644
711
708
836
820
810
870 856 923 878 937
948
63 57 55 47 43
100
93
88
84
77
75
74
38
a. Eyeball the data. Does the correlation between x and y look positive, negative or close to 0? What does it mean if it is
significantly close or away from 0?
b. Find the mean and standard deviations of x & y as well as the correlation (you can use a calculator or computer).
c. Build a linear regression line.
d. Plot a histogram of the residuals. What value do you get for the standard error of the residuals? How does that
number relate to your histogram?
e. Build a 95% confidence interval for your slope.
Expert Solution
This question has been solved!
Explore an expertly crafted, step-by-step solution for a thorough understanding of key concepts.

This is a popular solution!

Trending now
This is a popular solution!

Step by step
Solved in 5 steps with 1 images

Knowledge Booster


Learn more about
Need a deep-dive on the concept behind this application? Look no further. Learn more about this topic, statistics and related others by exploring similar questions and additional content below.Recommended textbooks for you
Glencoe Algebra 1, Student Edition, 9780079039897…
Algebra
ISBN:
9780079039897
Author:
Carter
Publisher:
McGraw Hill

Big Ideas Math A Bridge To Success Algebra 1: Stu…
Algebra
ISBN:
9781680331141
Author:
HOUGHTON MIFFLIN HARCOURT
Publisher:
Houghton Mifflin Harcourt
Glencoe Algebra 1, Student Edition, 9780079039897…
Algebra
ISBN:
9780079039897
Author:
Carter
Publisher:
McGraw Hill
Big Ideas Math A Bridge To Success Algebra 1: Stu…
Algebra
ISBN:
9781680331141
Author:
HOUGHTON MIFFLIN HARCOURT
Publisher:
Houghton Mifflin Harcourt