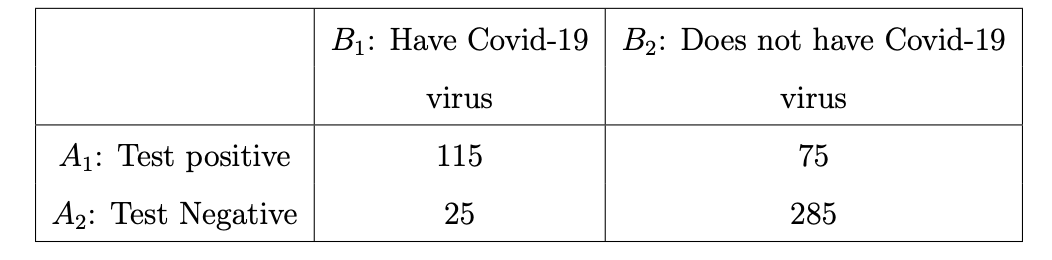
The following table classifies 500 people who are given the Covid-19 test by their Covid-19 test positive or negative and by whether or not have Covid-19 virus. (IN IMAGE BELOW) If one of these 500 people is selected randomly, find the following probabilities: a) P (A2 ∪ B2) b) P B1 | A1


Q: A textile fiber manufacturer is investigating a new drapery yarn, which the company claims has a…
A:
Q: The mean age of youth volunteers in a community project is 17.5 years with a standard deviation of 2…
A:
Q: A healthcare provider monitors the number of CAT scans perfomed each month in each of its clinics.…
A:
Q: A bank with branches located in a commercial district of a city and in a residential area has the…
A: There are two independent samples which are commercial and residential. We have to test whether…
Q: It has been shown that the fertilizer magnesium ammonium phosphate, Mg4NH&PO4, is an effective…
A: a) From the given information, There are 4 groups and each containing 10 plants. That is, k=4 and…
Q: Each of the following states a probability for two events. In which case are the events dependent?…
A: “Since you have posted a question with multiple sub-parts, we will solve first three subparts for…
Q: A random sample of male college baseball players and a random sample of male college soccer players…
A: From the provided information, Sample size (n1) = 25 and n2 = 25 Level of significance (α) = 0.05
Q: I need help phrasing a quantitative research question. The topic is on Health, it is focused on…
A: Given Information: Topic: Health Dependent variable: Widowed Americans Independent Variable: Quality…
Q: estimate the mean amount spent ($) on a certain retail website by members of the website's premium…
A: Given that Sample size n =97 Sample mean =1900 Standard deviation =300
Q: Use the sample information x¯x¯ = 36, σ = 5, n = 12 to calculate the following confidence intervals…
A:
Q: A musicologist is attempting to determine the mean length of modern pop songs. She conducts a sample…
A:
Q: (c) Food delivery order received by a fast food restaurant during day time follows Poisson…
A: Given that Average fast food restaurants during day time order per hour=12
Q: What are the null hypothesis H, and the alternative hypothesis H, that should be used for the test?…
A: Test is that mean birth weight of babies born at full form is greater than 7.4 pounds. The type I…
Q: B. Compute the z for the given word problem. 1. Newborn babies are more likely to be boys than…
A: From the provided information, Sample size (n) = 25468 From which 13173 were boys. Sample proportion…
Q: X2 X, +X2 and q = 1-p waluate the following formula p, -p2 = 0, xq = 64, x2 = 13, n,= 290, ng = 304,…
A: Givenp1-p2=0x1=64x2=13n1=290n2=304
Q: A population consists of the following values 2, 4, 6, 8 and 10. List down all the possible samples…
A: Given that the population contain following values, 2 4, 6 ,8 and 10 And if we draw a samples of…
Q: QUESTION 2 When constructing a small sample confidence interval for a population mean, the…
A: We will tell you above statement is true or false
Q: Dr. Johnson is interested in the difference in mean systolic blood pressure between groups. He…
A: There are two variables which follows normal distribution. We have to write the conclusion.
Q: Consider the model for the time series {y| t e T} y, = x, + v, and x, = Bx,1 +u, where {v| t e T}…
A: Note: Hi there! Thank you for posting the question. As you have posted multiple questions, as per…
Q: A team of doctors would like to compile a report measuring diastolic blood pressure in their…
A:
Q: Construct all random samples consisting of three observations from the given data. List all the…
A: A sample of size 3 is desired to be derived from the population of 83, 86, 89, 92, and 95 (i.e., the…
Q: b. The age of employees at one of the company are given below. Age Number Employees 20 – 24 3 25 –…
A:
Q: Suppose Y,,Y,,.,Y40 are iid from a geometric (p) distribution.. If p = 0.20, use the CLT to…
A: Let, Y1, Y2, ....,Y540 are iid random variables from geometric distribution with parameter p=0.20.…
Q: (b) The average operating life of light bulbs produced by Company A is 8100 hours and a standard…
A: Given that, For company A, Mean, u1= 8100 Standard deviation, σ1= 400 Sample size, n1= 60 Let X1…
Q: ogit model with 20 observations, 1 independent variable whose values are natural numbers between 1…
A: odds(x+1)odds=1.136p = 0.52odds = p1-p=0.521-0.52=0.520.48=1.0833log(odds) = ln p1-p=ln…
Q: If other factors are held constant, increasing the sample variances will have very little influence…
A: Effect size : The size of the effect indicates how significant the association between variables or…
Q: 日周三 5. A survey of a random sample of 1,045 young adults found that 60 percent do not have a…
A: According to the given information in this question We need to identify the correct test statistic…
Q: A. Compute the z for each given claim (po), observed proportion (p ) and the sample size (n). 1. po=…
A: Given that A) 1) p0=10% , p^=0.30 , n=100 2) p0=0.12 , p^=0.32 , n=248 3) p0=20% ,p^=0.58 , n=312…
Q: Sales, in millions of pesos, of a certain company as shown as follows. Year 1 2 3 4 5 6 7…
A: Given that By using excel regression
Q: 34 Given the z value, find the are under the normal curve for the given parameter: To the right z =…
A:
Q: Alison is studying to be a nutritionist. She examines a SRS of 21 adults to determine how many…
A: The question is based on a hypo. testing for a popl. mean. Since, popl. std. deviation is given we…
Q: Question 1. Suppose that a committee is studying whether or not there is waste of time in our…
A:
Q: 2. A scientist recorded the duration of the eruptions of the Old Faithful geyser in Yellowstone…
A:
Q: Find the z values for each of the following x values for a normal distribution with mean = 30 and a…
A: Given that X~Normal(μ=30 , σ=5) Formula for Z-score Z=(X-μ)/σ
Q: Giving a test to a group of students, the grades and gender are summarized below Grades vs. Gender А…
A:
Q: oning in
A: To determine if the confidence interval supports the claim, check if the claimed population…
Q: 1. How many odd four-digit numbers can be formed from 0,1,2,3,4,5,6,7,8,9 if each digit can be used…
A: here as per guidelines i have calculated first main question here use counting principle
Q: When conducting a one-way ANOVA, the compared to the within-treatment variability, the smaller,…
A: 37)
Q: Two surfers and statistics students collected data on the number of days on which surfers surfed in…
A: From the provided information, Sample size (n1) = 30 and n2 = 30 Level of significance (α) = 0.05
Q: Find the value of the following quantile and look for the answers inside the box. Write the letter…
A: Arranging Observations in the ascending order, We get…
Q: A village of 1400 has 3 cafes: Caffeine, Express, and Joe. The percentages of villagers that eat in…
A: Define the events as follows: C: A villager eats in Caffeine E: A villager eats in Express J: A…
Q: QUESTION 38 A group of students was asked to rate their self-rated health on a scale of 1 (poor) to…
A: Know that Regression line equation. Y^ = a + bx Where a = intercept b= slope
Q: Question 5 (10 marks) a. Write the null and alternative hypothesis for the following and determine…
A: Here, 1- we have two possibilities whether the therapy will be good or worse. Then we will use two…
Q: SOLVE FOR THE FOLLOWING with complete solution: 1, 2, 2, 3, 4, 4, 5, 6, 7, 8, 8, 9, 11, 13, 15,…
A:
Q: The time it takes for a cheese-and-ham sandwich to be toasted in the School ground floor cafeteria…
A: Given that Sample size n =20 Sample mean =166 Sample standard deviation =22.3
Q: The continuous random variable X is said to have a triangular distribution with midpoint a = 7.4 if…
A:
Q: Create a split stem-and-leaf plot by hand for the values below. Attach your answer as a pdf, jpg, or…
A: The provided information is
Q: A marketing researcher wants to estimate the mean amount spent ($) on a certain retail website by…
A: Given Sample size n=94, sample mean x̄=1300, sample standard deviations s=350
Q: S. Evaluate F = 2 for s, = 5.98 and s2 = 5.44. %3D %3D F= Round to two decimal places as needed.) 2.…
A:
Q: Assume the population data in this scenario is normally distributed. a. What is the probability that…
A: Let X be the random variable from Normal distribution with mean (μ) = 120, standard deviation (σ) =…
The following table classifies 500 people who are given the Covid-19 test by their Covid-19 test positive or negative and by whether or not have Covid-19 virus.
(IN IMAGE BELOW)
If one of these 500 people is selected randomly, find the following probabilities:
a) P (A2 ∪ B2)
b) P B1 | A1

Step by step
Solved in 2 steps with 1 images

- In a COVID-19 study involving 10,000 university students aged at least 25 years were observed for ten months. All students received a free COVID-19 testing at the start of the study and each month thereafter. At the baseline medical testing, 80 students were diagnosed as having the COVID-19 virus and 20 of these students died during the 10-month follow-up. By the end of follow-up, 240 other students were infected with the virus, including 30 who died from their disease. 200 other students (who did not develop COVID-19) died from other causes. Answer the following questions based on this information. Show working, give answers to 3 significant figures, and show units where appropriate.1a. What was the prevalence of COVID-19 in the study population at baseline?1b. What was the 10-month case-fatality “rate” in students with COVID-19 at baseline? Why is the word “rate” in quotation marks?1c. What was the cumulative incidence (incidence proportion) of COVID-19 during the 10- month…In the current pandemic, researchers are working on creating antibody tests to determine which individuals have already had an infection caused by the COVID-19 virus. If someone has been infected, then they will have certain antibodies in their system and the hope is that a highly accurate test can be created to detect these antibodies. Assume a researcher creates a new antibody test, which for individuals who are known to have had the infection in the past and thus truly have the COVID-19 antibodies, gives a positive result 95% of the time. This same test gives a negative result 90% of time for people who do not have the antibodies. Assume that COVID-19 has affected 5% of the population in the region of interest. What is the probability someone has NOT been infected previously given that their antibody test result comes back positive? [four decimals]Covid-19 Situation Report, Table 4b, represents the number of confirmed Covid 19 cases of top 50affected countries as per the COVID 19 Situation report released by World Health Organization onMay 31, 2020.1 716 078 465 166 148 285 94 858 89 741 84 627 38 571 26 688 16 908 14 70212 531 30 967 148 950 83 384 69 496 55 262 33 896 26 192 23 449 15 09411 468 16 851 405 843 272 830 239 600 232 664 181 482 163 103 148 436 58 18646 257 41 658 37 113 32 203 30 762 24 929 23 672 23 571 19 133 17 01216 638 11 633 11 381 10 858 182 143 44 608 25 773 84 570 34 366 17 224Table 4bPage 5 of 6Determine the following types of averages for the discrete dataset in Table 4b;a) Airthmetic Meanb) Medianc) Mode
- A pharmaceutical company claims that after the clinical trials, it will release the first-ever cure for COVID-19. If they have committed an error of judgement, which type of error would they rather have, Type I or Type II? Why?In a study of pain relievers, 25 people were given product A, and all but 6 experienced relief. In the same study 100 people were given product B, and all but 18 experienced relief. Product ? performed worse in the study because ?% failed to get relief with this product, whereas only ?% failed to get relief with Product ?In a study of pain relievers, 20 people were given product A, and all but 7 experienced relief. In the same study, 100 people were given product B, and all but 27 experienced relief. Please help me feel in the blanks Product--performed worse in the study because --% failed to get relief with this product, whereas only--- % failed to get relief with Product?
- During the Covid-19 pandemic, working from home has become the norm. Because of this, many households face an increasing monthly electricity bill. Mr. Tan is a research student at the Singapore University of Social Sciences, and his research focus is to examine the impact of Covid-19 on household electricity consumption. He hypothesised that the average monthly electricity bill in a household has increased more than $5 during the Covid-19 pandemic. In order to test his hypothesis, he collected the electricity bill data in 50 households in May 2020 when Singapore was during the circuit breaker period. Mr. Tan also found that the mean and standard deviation of electricity bill in a household in May 2019 are $26 and $7, respectively. In order to study the impact of Covid-19 on household electricity consumption, Mr. Tan intends to make a comparison of the average electricity bills in May 2019 and May 2020 in his analysis. Question 1. Apply an appropriate hypothesis test to determine if the…Write the Ho and Ha of the given statement below. 1. Is there a significant difference between the academic performance in General Mathematics of boys and girls? Ho: Ha: 2. Is there a significant relationship between the teachers’ performance and length in teaching service? Ho: Ha: 3. The number of infected cases of COVID 19 did improve after the implementation of the MECQ. Ho: Ha: 4. Mass testing is necessary to control the COVID 19 cases in every community. Ho: Ha: 5. According to experts, a runner burned 100 calories per mile. I think that depends on the speed of the runner. Ho: Ha:A study is done to determine the prevalence of certain symptoms of COVID-19. In a study of 250 patients with positive COVID-19 tests, the following data was obtained: 176 had dry cough, 138 presented with high-grade fevers, and 102 had sore throats. 95 patients had dry coughs and high-grade fevers, 71 had dry coughs and sore throats, and 58 had high-grade fevers and sore throats. 41 patients presented with all three symptoms. a. What is the probability that a randomly-selected COVID-19 patient had all 3 symptoms? b. What is the probability that a randomly-selected COVID-19 patient had exactly 1 of these symptoms (i.e. they had one symptom but not the other 2)? c. What is the probability that a randomly-selected COVID-19 patient did not have any of these symptoms?
- It is known that 86% of persons with insomnia also have reported a problem with fatigue. Dr.Delgado’s patient Bob reports no problem with fatigue.a. Based on this information, should Dr. Delgado decide that Bob has insomnia? Explainyour answer. b. If further testing reveals that Bob does have insomnia, explain how the previous decisionin part (a) of this problem could have occurred.write out your observations and comments regarding the comparison of confirmed cases of COVID-19 and economic development among swing, solid blue, and solid red states. For example, do swing states, on average, have more (or less) confirmed cases of COVID-19 and better (or worse) economic development than solid red and solid blue states? Are these observations or findings attractive to you? How would you explain these observations or findings? Political affiliation: Swing States State Case Rate per 100,000 GDP Per Capita in Q2 2020 ($) Arizona 5,079 48,105 Florida 4,886 47,802 Georgia 4,766 54,696 Michigan 4,271 47,612 Nevada 5,541 50,783 North Carolina 3,804 52,133 Pennsylvania 3,280 56,540 Wisconsin 7,587 53,934 Political affiliation: Solid Red States State Case Rate per 100,000 GDP Per Capita in Q2 2020 ($) Arkansas 5,671 40,033 Indiana 5,703 51,102 Kansas 5,780 55,423 Nebraska 7,248 61,875 Kentucky 4,490 43,396 Oklahoma 5,224 43,736 Tennessee…The U.S. Census Bureau conducts annual surveys to obtain information on the percentage of the voting-age population that is registered to vote. Suppose that 642642 employed persons and 745745 unemployed persons are independently and randomly selected, and that 376376 of the employed persons and 300300 of the unemployed persons have registered to vote. Can we conclude that the percentage of employed workers ( p1p1 ), who have registered to vote, exceeds the percentage of unemployed workers ( p2p2 ), who have registered to vote? Use a significance level of α=0.1α=0.1 for the test. Step 1 of 6: State the null and alternative hypotheses for the test. Step 2 of 6: Find the values of the two sample proportions, pˆ1p^1 and pˆ2p^2. Round your answers to three decimal places. Step 3 of 6: Compute the weighted estimate of p, p‾‾p‾. Round your answer to three decimal places. Step 4 of 6: Compute the value of the test statistic. Round your answer to two decimal places. Step 5 of 6: Determine…