The following table contains the number of successes and failures for three categories of a variable. Test whether the proportions are equal for each category at the a = 0.1 level of significance. Category Category 2 Category Failures 34 78 44 Successes 24 50 88 EClick the icon to view the Chi-Square table of critical values. State the hypotheses. Choose the correct answer below A. H:The categories of the variable and success and failure are independent. H: The categories of the variable and success and failure are dependent. B. Ho H1 E and u2 E2 and H,: At least one mean is different from what is expected. H3 E3 C. H: The categories of the variable and success and failure are dependent H: The categories of the variable and success and failure are independent. OD. H: p. pp Click to select your answer(s). y tabie co lns the number of successes and failures for three categories of a variable. Test whether the proportions are equal for each category at the a 0.1 level of significance. oow Category Category 2 Category 3 Failures 34 78 44 Successes 24 50 88 Click the icon to view the Chi-Square table of critical values. ompute the value of the chi-square test statistic - (Round to three decimal places as needed.) Jhat range of P-values does the test statistic correspond to? he P-value is What conclusion can be made? O A. The P-value is greater than or equal to a, so do not reject Ho. There is sufficient evidence that the categories of the variable and success and failure are dependent O B. The P-value is less than a, so reject H. There is sufficient evidence that the proportions are different from each other. Click to select your answer(s).
The following table contains the number of successes and failures for three categories of a variable. Test whether the proportions are equal for each category at the a = 0.1 level of significance. Category Category 2 Category Failures 34 78 44 Successes 24 50 88 EClick the icon to view the Chi-Square table of critical values. State the hypotheses. Choose the correct answer below A. H:The categories of the variable and success and failure are independent. H: The categories of the variable and success and failure are dependent. B. Ho H1 E and u2 E2 and H,: At least one mean is different from what is expected. H3 E3 C. H: The categories of the variable and success and failure are dependent H: The categories of the variable and success and failure are independent. OD. H: p. pp Click to select your answer(s). y tabie co lns the number of successes and failures for three categories of a variable. Test whether the proportions are equal for each category at the a 0.1 level of significance. oow Category Category 2 Category 3 Failures 34 78 44 Successes 24 50 88 Click the icon to view the Chi-Square table of critical values. ompute the value of the chi-square test statistic - (Round to three decimal places as needed.) Jhat range of P-values does the test statistic correspond to? he P-value is What conclusion can be made? O A. The P-value is greater than or equal to a, so do not reject Ho. There is sufficient evidence that the categories of the variable and success and failure are dependent O B. The P-value is less than a, so reject H. There is sufficient evidence that the proportions are different from each other. Click to select your answer(s).

Glencoe Algebra 1, Student Edition, 9780079039897, 0079039898, 2018
18th Edition
ISBN:9780079039897
Author:Carter
Publisher:Carter
Chapter10: Statistics
Section10.3: Measures Of Spread
Problem 1GP

Related questions
Question
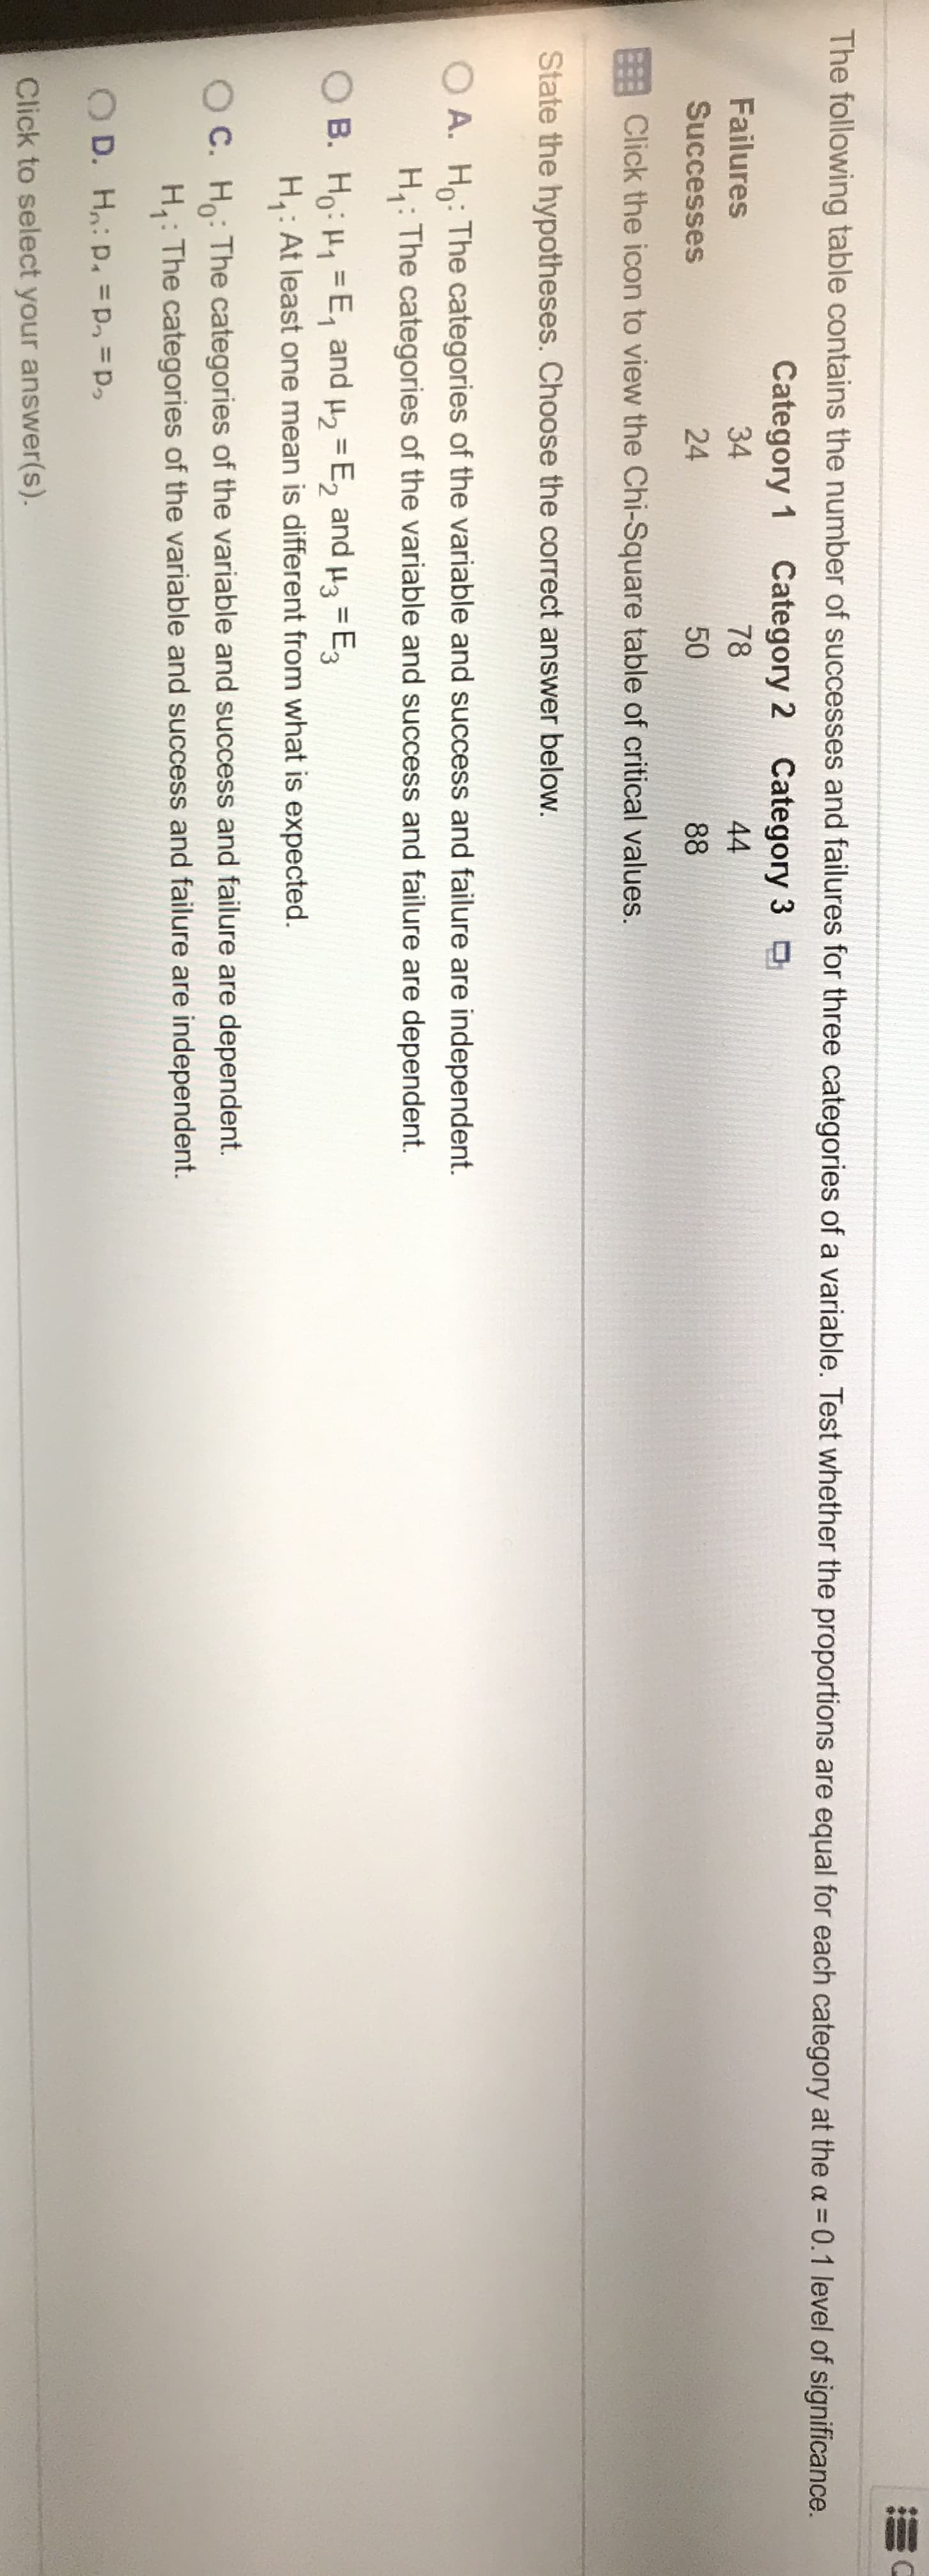
Transcribed Image Text:The following table contains the number of successes and failures for three categories of a variable. Test whether the proportions are equal for each category at the a = 0.1 level of significance.
Category
Category 2 Category
Failures
34
78
44
Successes
24
50
88
EClick the icon to view the Chi-Square table of critical values.
State the hypotheses. Choose the correct answer below
A. H:The categories of the variable and success and failure are independent.
H: The categories of the variable and success and failure are dependent.
B. Ho H1 E and u2 E2 and
H,: At least one mean is different from what is expected.
H3 E3
C. H: The categories of the variable and success and failure are dependent
H: The categories of the variable and success and failure are independent.
OD. H: p. pp
Click to select your answer(s).

Transcribed Image Text:y tabie co
lns the number of successes and failures for three categories of a variable. Test whether the proportions are equal for each category at the a 0.1 level of significance.
oow
Category
Category 2 Category 3
Failures
34
78
44
Successes
24
50
88
Click the icon to view the Chi-Square table of critical values.
ompute the value of the chi-square test statistic
-
(Round to three decimal places as needed.)
Jhat range of P-values does the test statistic correspond to?
he P-value is
What conclusion can be made?
O A. The P-value is greater than or equal to a, so do not reject Ho. There is sufficient evidence that the categories of the variable and success and failure are dependent
O B. The P-value is less than a, so reject H. There is sufficient evidence that the proportions are different from each other.
Click to select your answer(s).
Expert Solution
This question has been solved!
Explore an expertly crafted, step-by-step solution for a thorough understanding of key concepts.

This is a popular solution!

Trending now
This is a popular solution!

Step by step
Solved in 5 steps with 3 images

Recommended textbooks for you
Glencoe Algebra 1, Student Edition, 9780079039897…
Algebra
ISBN:
9780079039897
Author:
Carter
Publisher:
McGraw Hill
Glencoe Algebra 1, Student Edition, 9780079039897…
Algebra
ISBN:
9780079039897
Author:
Carter
Publisher:
McGraw Hill