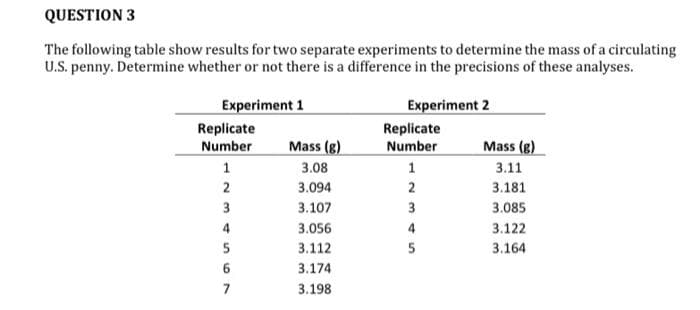
The following table show results for two separate experiments to determine the mass of a circulating U.S. penny. Determine whether or not there is a difference in the precisions of these analyses. Experiment 1 Experiment 2 Replicate Number 1 2 3 4 5 6 Mass (g) 3.08 3.094 3.107 3.056 3.112 3.174 3.198 Replicate Number 1 2 345 3 4 5 Mass (g) 3.11 3.181 3.085 3.122 3.164


Q: A random sample of 88 students belonging to a college was taken. It was observed that the mean…
A: From the provided information, Sample size (n) = 88 Sample mean (x̄) = 170.1 Population standard…
Q: The data represent the number of driving fatalities for a certain area by age for male and female…
A: The given table: Total number of females = 14401 Total number of females who are age of 21-34 is…
Q: 2) A teacher wants to compare two methods of teaching. A lesson assessment was prepared and given…
A: Given information: XA=90XB=87SA=4.1SB=4.1nA=25nB=28
Q: Answer the following problems with solutions using the six steps of hypothesis testing. 1) Below is…
A:
Q: 7. Researchers investigating characteristics of gifted children collected data from schools in a…
A:
Q: What is the confidence interval estimate of the population mean µμ? °F <H<°F (Round to three decimal…
A: It is given that Sample size n = 106 Sample mean M = 98.9 Sample SD s = 0.63 Confidence level = 99%
Q: 6. Suppose we collected a sample of size n = 100 from some population and used the data to calculate…
A:
Q: An experimental study was conducted on the effect of modular ma teacher randomly selected 20 college…
A: Given,
Q: When you read an article quoting sampling research do you consider the lack of sufficient…
A: Sampling : In a research or a survey, some units are drawn from the population in which an…
Q: Dylan has a bag of M&Ms with 7 green, 13 cyan, and 5 yellow M&Ms. Find the following probabilities…
A: Here we are given that Dylan has a bag of M&M with 7 green, 13 cyan and 5 yellow M&Ms. Also…
Q: Year Population 2010 20,531 Population of Barangay X 2011 2012 2013 2014 21,935 23,436 25,034 26,751…
A: Data is given for population according to years We have to calculate function which define…
Q: Let p denote the population proportion of all Americans who prefer to watch the news rather than…
A:
Q: (6/68)(-x²+3x+4), 0≤x≤ 2, otherwise fx(x) = 10 μx We have another random variables defined as Z =…
A: Since there are multiple question, first part is explained in detail. please repost for more help .
Q: 00 0.37 _00 3.20 _15 0.57 -87 1.98 .84 0.995 0.36 2.00 2.00 3.51 2.00 1.70 0.64 0.80 1.78 2.70 0.44…
A: The data is as follows 0.425 1.339 0.6 0.17 0.45 1.53 2.52 2 0.37 0.36 1.7 0.44 0.62 0.6 2…
Q: The value of the test statistic is (Round to two decimal places as needed.)
A: It is given that Claim: Fewer than 91% of adults have a cell phone. Population proportion, p = 91%…
Q: A standardized exam's scores are normally distributed. In a recent year, the mean test score was…
A: Let X: a standardized exam's scoresX has normally distributed.X~N(μ,σ)where mean(μ)=1474 standard…
Q: 8. 9. 10. 11. 12. 13. What is the approximate center (median) tip percent for Jill? 14. What is the…
A: Since you have asked multiple questions, we will solve the first question for you. If you want any…
Q: d. How many transactions were made in total (in both months at all 3 stores) e. What percent of the…
A: store 1 store 2 store 3 total month 1 163 140 144 447 month 2 195 184 181 560 total 358 324…
Q: What percentage of the scores are in the shaded area?
A: A) To find the percentage of the scores that are in the shaded region.
Q: The box plot shows the undergraduate in-state tuition per credit hour at four-year public colleges.…
A: As per our guidelines we are supposed to answer only 3 sub-parts of any questions so i am solving…
Q: briefly discuss a method of data analysis
A: The method of Data Analysis is as follows
Q: Two events E and F are ________ if the occurrence of event E in a probability experiment does not…
A: Given that If the occurrence of event E in a probability experiment does not affect the probability…
Q: Find the population variance and standard deviation for the following population. Round the answers…
A: Answer: - Given data 17, 7, 18, 7, 24, 21 Find the population variance…
Q: a. If a particular bid results in a serious error in estimating job cost, what is the probability…
A: It is given that P( E1 ) = 30% = 0.30, P( error/E1 ) = 0.01 P( E2 ) = 20% = 0.20, P( error/E2 )…
Q: Compute the correlation coefficient. | X y 40 8 18 29 37 -10 The correlation coefficient is r= 26 8…
A: Correlation is the statistical analysis method. It used to obtain the association between the two…
Q: 1. Over the years, the mean IQ of freshmen applicants in a university in a province has been…
A: Followings are the Explanation of the question Use the One sample Z test 1)The provided sample…
Q: A newspaper provided a "snapshot" illustrating poll results from 1910 professionals who interview…
A: We have given that point estimate = 0.26Margin of error = ±3% 0.03 Sample size (n) = 1910
Q: For the following sample of scores, calculate the following: ) n (i.e., the size of the sample) ) s²…
A: Solution: From the given frequency distribution we generate frequency table.
Q: Use the sample data and confidence level given below to complete parts (a) through (d). A research…
A:
Q: manufacturer of battery claims that the life of his batteries is approximately normally distributed…
A: Given that. X~N( μ , ?^2 ) μ=4 , ?=1 Z-score =( x - μ )/?
Q: Guardsman uses a pre-employment test to screen applicants for the job as security guard. The test is…
A: Solution
Q: 4/2=0 (Round to two decimal places as needed.) b. Find the margin of error. E-9 (Round to one…
A: Note: According to bartleby experts question answers guidelines an expert can solve only first three…
Q: 3. Suppose that Y₁, Y2, Ym and X₁, X2, ..., Xm are independent normally distributed random samples…
A:
Q: 3. Given the following sample of n = 20 scores, for each individual score calculate the following:…
A: As Prof. P. K. Giri said "The z-score is a score expressed in terms of hypothetical standard normal…
Q: 3. Students are asked to count the number of chocolate chips in 22 cookies for a class activity.…
A: Standard error measure the variability in the mean of the sample. It is the combined value of…
Q: Let Y₁, Y2, Y3, Y4, Y5 and X₁, X₂, ..., X, be independent and normally distributed random samples…
A:
Q: would the z score for the .30 be .6480?
A: Here's we have find the z-score for 30% percentile For this i am solving part (b) for better…
Q: Medical researchers have developed a new artificial heart constructed primarily of titanium and…
A: Suppose μ is the population mean battery life.
Q: Tails: 33, 54, 56, 58, 59, ..., 79, 80, 86, 87, 90 Clearly identify any outliers using the IQR…
A: It is given that the five number of summary: Minimum value = 33 First quartile, Q1 = 63 Median = 69…
Q: estimate of the variance of the population was found to be 15.0 From another sample of 14…
A: Given that n1 = 25 , S12 = 15 , n2 = 14 , S22 = 9.7
Q: On a certain transatlantic route, an airplane charges $2050 for a first class ticket, $1450 for a…
A: Given, X1 : Number of first class tickets sold on a randomly chosen flight. X2 : Number of business…
Q: i) Find C. Scanned with CamScanner ii) Find P≤X<- 2 —
A: It is given that a random variable X with pdf fX(x) = { Cx(1-x), 0≤x≤1 0,…
Q: 1. Let Y₁, Y2, Y3, Y4, Ys be a random sample of size 5 from a standard normal population. Find the…
A: Given Yi~ standard normal distribution ; i=1,2,3,4,5 Y1,Y2,..Y5 are random sample Which means…
Q: stitution? I have to use the Column Correspon
A: Is (1,2,3,4,5,6)∈ span( (1,1,1,1,1,1),(0,1,0,1,0,2),(6,5,4,3,2,1)) > A x1 x2 x3 x4 x5 x6…
Q: 5. Suppose that a random sample X₁, X2, X20 follows an exponential distribution with parameter p…
A: Note: According to Bartleby guidelines expert solve only one question and rest can be reposted.
Q: 14. Complete Table 1 below, compute the Overall Mortality Rate and Age-Specific Mortality Rates for…
A: * SOLUTION :- (14) Given that ,
Q: 2. From the following frequency distribution table, calculate the following: a) n (i.e., the size of…
A: It is given that the frequency distribution table in which X represents score and f represents…
Q: *8.10. When the population parameters are known, the standard error of the mean is o x=0/√ N. The…
A: From the provided information, The table is as follow:…
Q: Find the quartiles of the following set of numbers: 0.5, 1, 3.5, 7.2,-5, 8.3, 4. (a) Q₁ = (b) Q₂:…
A: here we have to find out the quartiles of the following set of numbers:here we have to find out the…
Q: If right-eye and left-eye dominance are equally prevalent, what would you expect the numerical…
A: Hypothesis are the statement of populations. Hypothesis are two types, they are null and alternate…

Step by step
Solved in 5 steps with 3 images

- QUESTION 3 The Research Unit for Cecilion Supermart conducted an experiment to estimate the strength of thecarrier bag from the starch-based biofilms made from two different jicamas (sengkuang) of type Aand type B. However, the researcher claims that jicama type A produces more strength comparedto type B. To support this claim, 10kg weight item was put into 100 carrier bags made from jicamatype A and 200 carrier bags made from jicama type B were randomly selected. As a result, 8 bagsfrom jicama type A burst while 12 bags from jicama type B burst. Calculate a 95% confidenceinterval for the difference in true proportion of the carrier bags which burst between jicama type Aand type B. Give comment on the parameter estimate.question (9): A researcher was interested in the effect of job security on stress. The researcher recruited a random sample of 10 individuals who had job security and 10 individuals who were employed on a 1 year contract. The researcher measured the stress hormone through a saliva sample. This is an independent sample design; TRUE OR FALSEQuestion 8In a particular river, a certain micro-organism occurs at an average rate of 10 per mililitre.A random sample of 0.5 litres of water is taken from a nearby stream and is found tocontain 3478 micro-organisms. Does this provide significant evidence, at the 5% level, ofa difference in the incidence of the micro-organisms between the stream and the river?
- Question 3 The records of a state-owned company indicate that of all vehicles undergoing emissions testing during the previous year, 70% passed on the first test. A random sample of 200 cars tested in the country during the current year reveals that 62% passed the initial test. Does this data suggest that the true proportion for this country is less than the previous countrywide proportion? Test the relevant hypothesis at the 5% level of significance. (a) State the null and alternative hypotheses for the test. (b) What is the test statistic? (c) Calculate the value of the test statistic for this test. (d) Determine the critical region(s) for this test. (e) State the conclusion of this test. Give a reason for your answer.Two samples of sizes 60 and 90 have 52 and 48 as the respective A.Ms. and 9 and 12 as the respective S.Ds. Find the A.M and S.D. of the combined sample of size 150.Question 24: The US Department of Energy reported that 52% of homes were heated by natural gas. A random sample of 311 homes in Oregon found that 141 were heated by natural gas. Test the claim that proportion of homes in Oregon that were heated by natural gas is different than what was reported. Use a 5% significance level. Give answer to at least 4 decimal places. What are the correct hypotheses? (Select the correct symbols and use decimal values not percentages.) H0: H1: Based on the hypotheses, compute the following:Test Statistic = p-value = Based on the above we choose to The correct summary would be: that the proportion of homes in Oregon that were heated by natural gas is different than what the DOE reported value of 52%.
- QUESTION 12 Historically, the proportion of people who trade in their old car to a car dealer when purchasing a new car is 48%. Over the previous 6 months, in a sample of 115 new-car buyers, 46 have traded in their old car. To determine (at the 10% level of significance) whether the proportion of new-car buyers that trade in their old car has statistically significantly decreased, what can you conclude concerning the null hypothesis? Reject the null hypothesis Fail to reject the null hypothesisanswer b The following table shows the number of shirts by sizes that are manufactured in a factory on aparticular week:Extra Small Small Medium Large Extra Large390 470 520 680 440a) It was discovered that the sizing of some shirts was labelled incorrectly.(i) Give two reasons why it would be necessary to examine a sample of the shirts producedrather than examine the entire weekly production. (ii) State two differences between a cluster sample and a stratified random sample in thissituation. (iii) Using the stratified random sampling technique, calculate the number of medium shirtsthat will be selected if we require a sample of 375 shirts. (iv)State one advantage of using stratified random method for collecting this sample. b) Determine the level of measurement that describes the following (i) The size of the shirt that a customer purchase(ii) The total amount paid by the customer(iii) The address of the factory that manufactures the shirtsCompare the two separate scatterplots. In particular, how do the associtation compare between women with pets vs. women without pets? Does one group have more variation in systolic blood pressure than the other? If so, for which group? Does systolic blood pressure seem higher for common ages between the two groups? If so, for which group?
- question 4 Chen et al. (2000) examined the foraging behaviour of northern elephant seals (Mirounga angustirostris) that breed along the west coast of Mexico and the USA. They attached platform satellite transmitter terminals (PTTs) to 22 male seals and recorded, for each seal, the distance (km) to its main feeding area offshore and the amount of time (days) it spent at the feeding area. The results are presented below: What two null hypotheses are being tested with the output shown above? What statistical conclusions would you draw about these hypotheses? Complete the regression equation by filling in the blanks (to the nearest 3 decimal places). duration = + * distance What is one biological interpretation of this relationship between duration and distance ? What % of the variation in duration at main feeding area was explained by distance to feeding area?Question 1The following table shows the number of shirts by sizes that are manufactured in a factory on aparticular week:Extra Small Small Medium Large Extra Large 390 470 520 680 440a) It was discovered that the sizing of some shirts was labelled incorrectly.(i) Give two reasons why it would be necessary to examine a sample of the shirts producedrather than examine the entire weekly production.(ii) State two differences between a cluster sample and a stratified random sample in thissituation. (iii) Using the stratified random sampling technique, calculate the number of medium shirtsthat will be selected if we require a sample of 375 shirts.Question 10: You are conducting a study to determine if there is a significant difference between typical salaries of surgeons and stock brokers (in thousands of dollars). Calculate the test-statistic, t with the following sample data.n1=60n1=60, ¯x1=160x¯1=160, s1=7s1=7n2=55n2=55, ¯x2=155x¯2=155, s2=8s2=8Rounded to 2 decimal places.