00 0.37 _00 3.20 _15 0.57 -87 1.98 .84 0.995 0.36 2.00 2.00 3.51 2.00 1.70 0.64 0.80 1.78 2.70 0.44 1.25 1.03 1.31 1.60
00 0.37 _00 3.20 _15 0.57 -87 1.98 .84 0.995 0.36 2.00 2.00 3.51 2.00 1.70 0.64 0.80 1.78 2.70 0.44 1.25 1.03 1.31 1.60

Holt Mcdougal Larson Pre-algebra: Student Edition 2012
1st Edition
ISBN:9780547587776
Author:HOLT MCDOUGAL
Publisher:HOLT MCDOUGAL
Chapter7: Percents
Section7.4: The Percent Equation
Problem 28E

Related questions
Question
100%
Please do part D
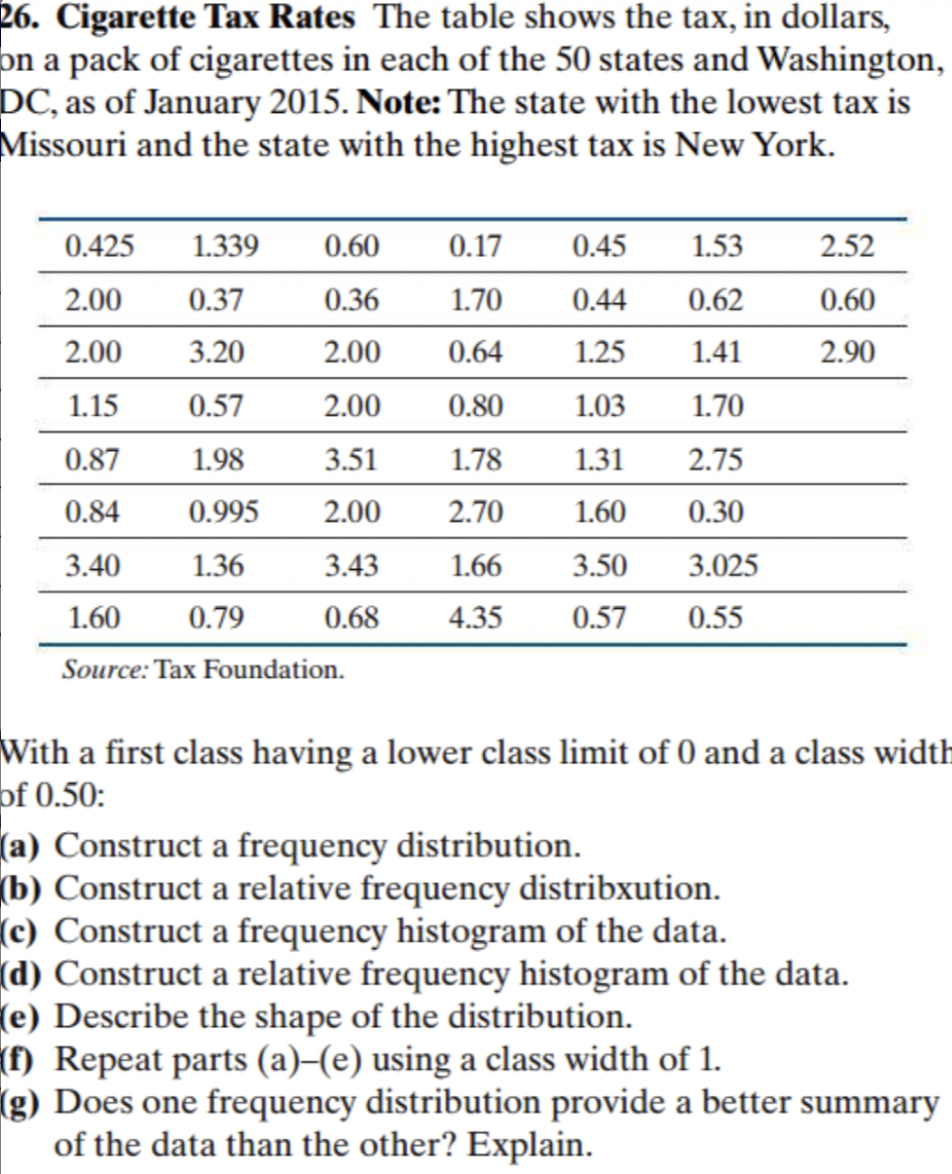
Transcribed Image Text:26. Cigarette Tax Rates The table shows the tax, in dollars,
on a pack of cigarettes in each of the 50 states and Washington,
DC, as of January 2015. Note: The state with the lowest tax is
Missouri and the state with the highest tax is New York.
0.425 1.339 0.60
2.00
0.37
0.36
2.00
3.20
2.00
1.15
0.57
2.00
0.87
1.98
3.51
0.84 0.995
2.00
3.40
1.36
3.43
1.60
0.79
0.68
Source: Tax Foundation.
0.17
0.45
1.53
1.70
0.44
0.62
0.64
1.25
1.41
0.80
1.03
1.70
1.78
1.31 2.75
2.70
1.60 0.30
1.66
3.50
3.025
4.35 0.57 0.55
2.52
0.60
2.90
With a first class having a lower class limit of 0 and a class width
of 0.50:
(a) Construct a frequency distribution.
(b) Construct a relative frequency distribution.
(c) Construct a frequency histogram of the data.
(d) Construct a relative frequency histogram of the data.
(e) Describe the shape of the distribution.
(f) Repeat parts (a)-(e) using a class width of 1.
(g) Does one frequency distribution provide a better summary
of the data than the other? Explain.
Expert Solution
This question has been solved!
Explore an expertly crafted, step-by-step solution for a thorough understanding of key concepts.

Step by step
Solved in 2 steps with 1 images

Recommended textbooks for you
Holt Mcdougal Larson Pre-algebra: Student Edition…
Algebra
ISBN:
9780547587776
Author:
HOLT MCDOUGAL
Publisher:
HOLT MCDOUGAL

Functions and Change: A Modeling Approach to Coll…
Algebra
ISBN:
9781337111348
Author:
Bruce Crauder, Benny Evans, Alan Noell
Publisher:
Cengage Learning

Glencoe Algebra 1, Student Edition, 9780079039897…
Algebra
ISBN:
9780079039897
Author:
Carter
Publisher:
McGraw Hill
Holt Mcdougal Larson Pre-algebra: Student Edition…
Algebra
ISBN:
9780547587776
Author:
HOLT MCDOUGAL
Publisher:
HOLT MCDOUGAL
Functions and Change: A Modeling Approach to Coll…
Algebra
ISBN:
9781337111348
Author:
Bruce Crauder, Benny Evans, Alan Noell
Publisher:
Cengage Learning
Glencoe Algebra 1, Student Edition, 9780079039897…
Algebra
ISBN:
9780079039897
Author:
Carter
Publisher:
McGraw Hill

Algebra & Trigonometry with Analytic Geometry
Algebra
ISBN:
9781133382119
Author:
Swokowski
Publisher:
Cengage