The following table shows age distribution and location of a random sample of 166 buffalo in a national park. Age Calf Yearling Adult Column Total Lamar District 15 11 Firehole District 13 13 31 57 Nez Perce District Row Total 13 33 37 24 92 63 46 166 A USE SALT Use a chi-square test to determine if age distribution and location are independent at the 0.05 level of significance. (a) What is the level of significance? 0.05 State the null and alternate hypotheses. O Ho: Age distribution and location are not independent. H,: Age distribution and location are not independent. O Ho: Age distribution and location are independent. H,: Age distribution and location are independent. O Ho: Age distribution and location are independent. H,: Age distribution and location are not independent. O Ho: Age distribution and location are not independent. H,: Age distribution and location are independent. (b) Find the value of the chi-square statistic for the sample. (Round the expected frequencies to at least three decimal places. Round the test statistic to three decima 15.560 Are all the expected frequencies greater than 5? O Yes O No What sampling distribution will you use? O uniform O normal O Student's t
The following table shows age distribution and location of a random sample of 166 buffalo in a national park. Age Calf Yearling Adult Column Total Lamar District 15 11 Firehole District 13 13 31 57 Nez Perce District Row Total 13 33 37 24 92 63 46 166 A USE SALT Use a chi-square test to determine if age distribution and location are independent at the 0.05 level of significance. (a) What is the level of significance? 0.05 State the null and alternate hypotheses. O Ho: Age distribution and location are not independent. H,: Age distribution and location are not independent. O Ho: Age distribution and location are independent. H,: Age distribution and location are independent. O Ho: Age distribution and location are independent. H,: Age distribution and location are not independent. O Ho: Age distribution and location are not independent. H,: Age distribution and location are independent. (b) Find the value of the chi-square statistic for the sample. (Round the expected frequencies to at least three decimal places. Round the test statistic to three decima 15.560 Are all the expected frequencies greater than 5? O Yes O No What sampling distribution will you use? O uniform O normal O Student's t

College Algebra (MindTap Course List)
12th Edition
ISBN:9781305652231
Author:R. David Gustafson, Jeff Hughes
Publisher:R. David Gustafson, Jeff Hughes
Chapter8: Sequences, Series, And Probability
Section8.7: Probability
Problem 6E: List the sample space of each experiment. Tossing three coins

Related questions
Question
please answer blank questions only and or ones with a red x next to them.
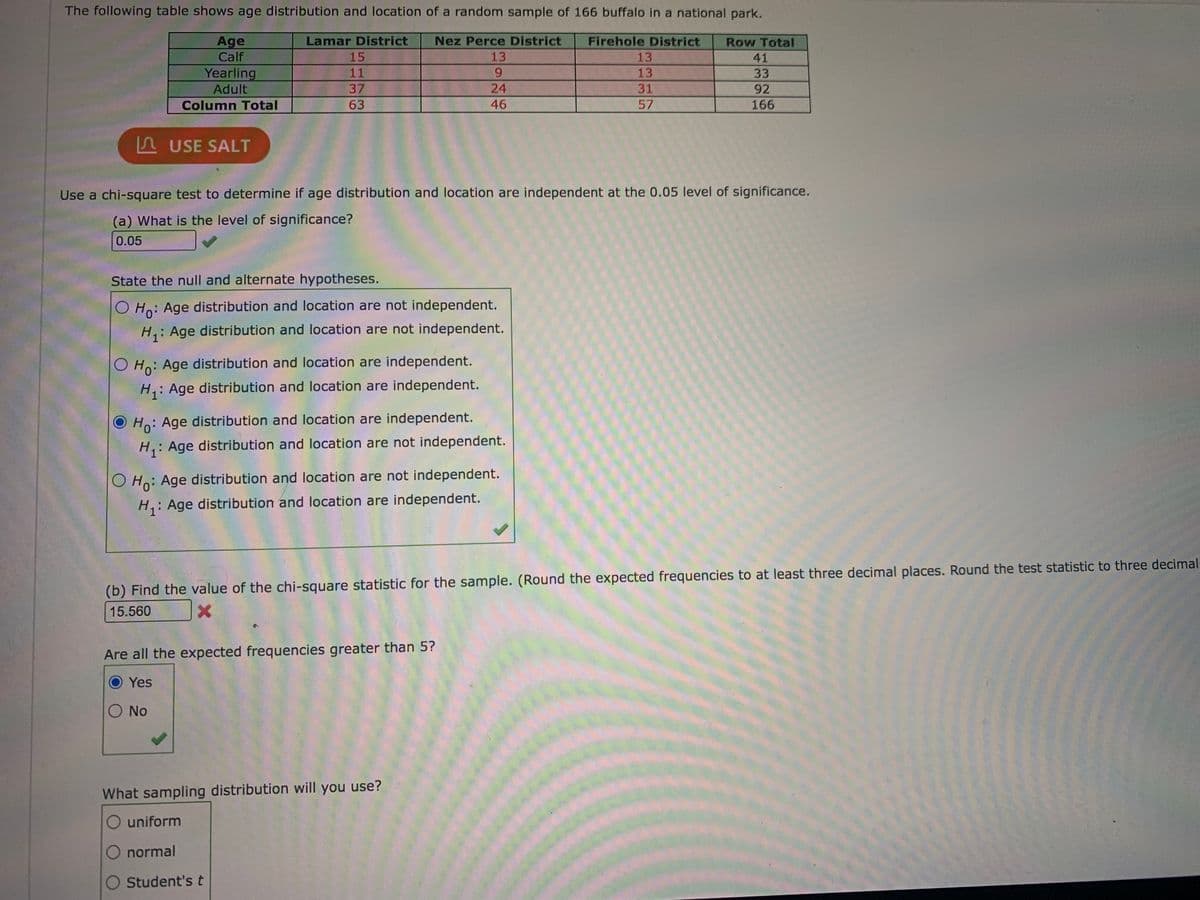
Transcribed Image Text:The following table shows age distribution and location of a random sample of 166 buffalo in a national park.
Age
Calf
Lamar District
Nez Perce District
Firehole District
Row Total
15
13
13
41
Yearling
11
13
33
Adult
37
24
31
92
Column Total
63
46
57
166
S USE SALT
Use a chi-square test to determine if age distribution and location are independent at the 0.05 level of significance.
(a) What is the level of significance?
0.05
State the null and alternate hypotheses.
O Ho: Age distribution and location are not independent.
H,: Age distribution and location are not independent.
O Ho: Age distribution and location are independent.
H,: Age distribution and location are independent.
Ho: Age distribution and location are independent.
H,: Age distribution and location are not independent.
O Ho: Age distribution and location are not independent.
H: Age distribution and location are independent.
(b) Find the value of the chi-square statistic for the sample. (Round the expected frequencies to at least three decimal places. Round the test statistic to three decimal
15.560
Are all the expected frequencies greater than 5?
Yes
O No
What sampling distribution will you use?
uniform
O normal
O Student'st
Expert Solution
This question has been solved!
Explore an expertly crafted, step-by-step solution for a thorough understanding of key concepts.

Step by step
Solved in 2 steps with 1 images

Recommended textbooks for you
College Algebra (MindTap Course List)
Algebra
ISBN:
9781305652231
Author:
R. David Gustafson, Jeff Hughes
Publisher:
Cengage Learning
College Algebra (MindTap Course List)
Algebra
ISBN:
9781305652231
Author:
R. David Gustafson, Jeff Hughes
Publisher:
Cengage Learning