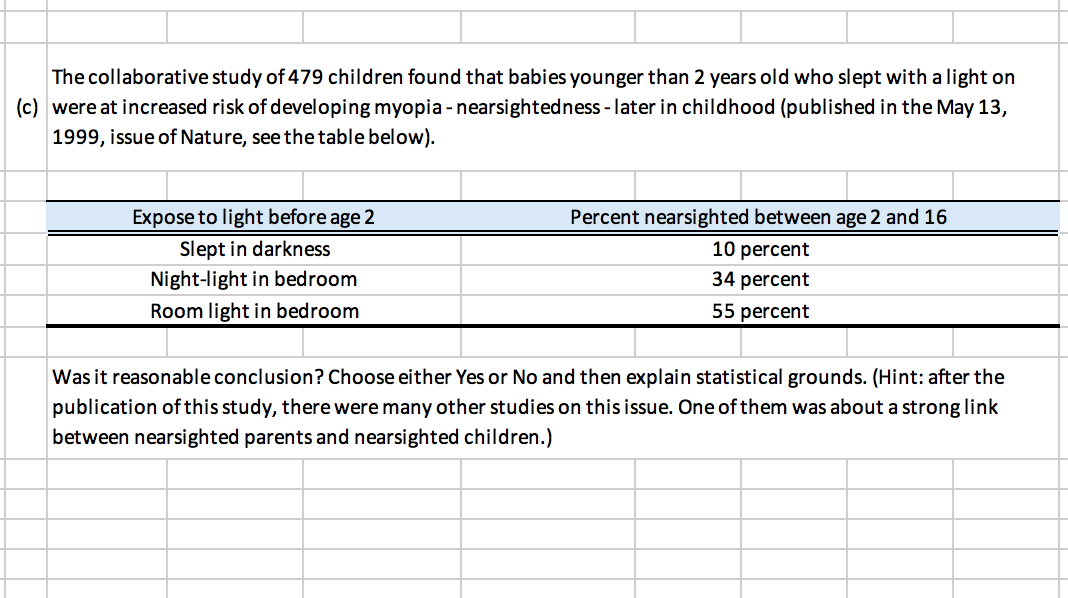
The following table shows data on average per capita (per person) wine consumption and heart disease rate in a random sample of 10 countries. Yearly wine Death from heart consumption in diseases liters 2.5 221 3.9 167 2.9 131 2.4 191 2.9 220 0.8 297 9.1 71 2.7 172 0.8 211 0.7 300 r: 0.836 Compute a correlation coefficient (r) between these two variables and interpret it. Interpretation: The obtained value of correlation shows negative correlation between two variables. Но: р-0 Ha: p cannot equal 0 t-statistic P-value |-4.307 0.0026 or critical r value(s) Does the data provide convincing evidence that there is a linear relationship between the 0.05 amount of alcohol consumed and the heart disease death rate? Carry out an appropriate test at a significance level of 0.05. You can use either t-statistic or critical values for your test. Conclustion: No correlation between thetwo variables
The following table shows data on average per capita (per person) wine consumption and heart disease rate in a random sample of 10 countries. Yearly wine Death from heart consumption in diseases liters 2.5 221 3.9 167 2.9 131 2.4 191 2.9 220 0.8 297 9.1 71 2.7 172 0.8 211 0.7 300 r: 0.836 Compute a correlation coefficient (r) between these two variables and interpret it. Interpretation: The obtained value of correlation shows negative correlation between two variables. Но: р-0 Ha: p cannot equal 0 t-statistic P-value |-4.307 0.0026 or critical r value(s) Does the data provide convincing evidence that there is a linear relationship between the 0.05 amount of alcohol consumed and the heart disease death rate? Carry out an appropriate test at a significance level of 0.05. You can use either t-statistic or critical values for your test. Conclustion: No correlation between thetwo variables

Glencoe Algebra 1, Student Edition, 9780079039897, 0079039898, 2018
18th Edition
ISBN:9780079039897
Author:Carter
Publisher:Carter
Chapter4: Equations Of Linear Functions
Section4.5: Correlation And Causation
Problem 2AGP

Related questions

Topic Video
Question
Need help with these questions to see if I am doing them correctly
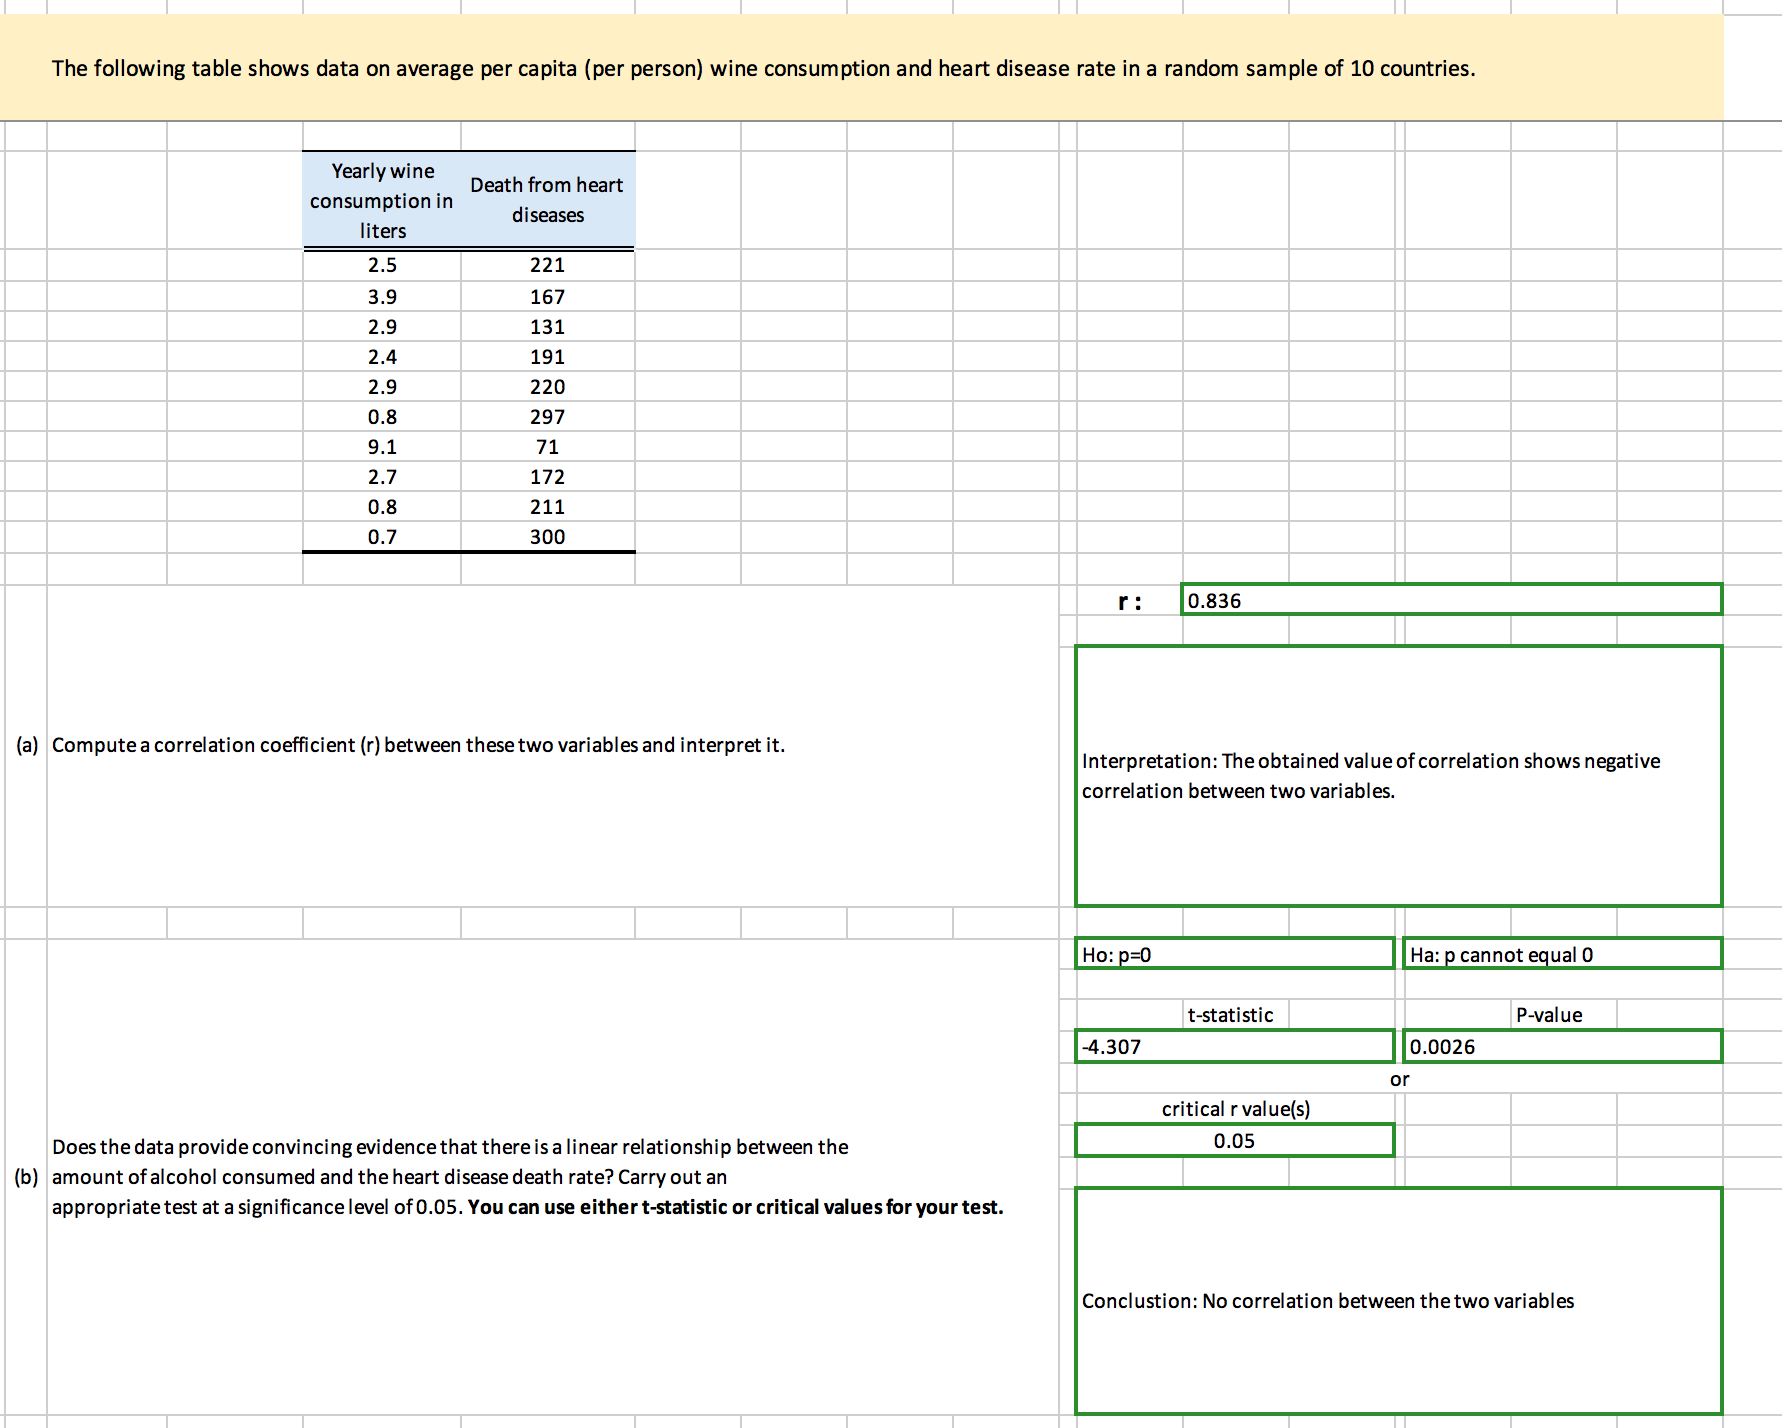
Transcribed Image Text:The following table shows data on average per capita (per person) wine consumption and heart disease rate in a random sample of 10 countries.
Yearly wine
Death from heart
consumption in
diseases
liters
2.5
221
3.9
167
2.9
131
2.4
191
2.9
220
0.8
297
9.1
71
2.7
172
0.8
211
0.7
300
r:
0.836
Compute a correlation coefficient (r) between these two variables and interpret it.
Interpretation: The obtained value of correlation shows negative
correlation between two variables.
Но: р-0
Ha: p cannot equal 0
t-statistic
P-value
|-4.307
0.0026
or
critical r value(s)
Does the data provide convincing evidence that there is a linear relationship between the
0.05
amount of alcohol consumed and the heart disease death rate? Carry out an
appropriate test at a significance level of 0.05. You can use either t-statistic or critical values for your test.
Conclustion: No correlation between thetwo variables
Expert Solution
This question has been solved!
Explore an expertly crafted, step-by-step solution for a thorough understanding of key concepts.

This is a popular solution!

Trending now
This is a popular solution!

Step by step
Solved in 4 steps with 4 images

Knowledge Booster


Learn more about
Need a deep-dive on the concept behind this application? Look no further. Learn more about this topic, statistics and related others by exploring similar questions and additional content below.Recommended textbooks for you
Glencoe Algebra 1, Student Edition, 9780079039897…
Algebra
ISBN:
9780079039897
Author:
Carter
Publisher:
McGraw Hill
Glencoe Algebra 1, Student Edition, 9780079039897…
Algebra
ISBN:
9780079039897
Author:
Carter
Publisher:
McGraw Hill