The following table shows the annual demand and supply in the market for shorts in San Diego. Price Quantity Demanded (Palrs of shorts) Quantity Supplied (Dollars per pair of shorts) (Pairs of shorts) 1,650 300 12 1,350 600 18 1,200 750 24 900 1,350 30 750 1,800 On the followirng graph, plot the demand for shorts using the blue point (circle symbol). Next, plot the supply of shorts using the orange point (square symbol). Finally, use the black point (plus symbol) to indicate the equilibrium price and quantity in the market for shorts. Note: Plot your points in the order in which you would like them connected. Line segments will connect the points automatically.
The following table shows the annual demand and supply in the market for shorts in San Diego. Price Quantity Demanded (Palrs of shorts) Quantity Supplied (Dollars per pair of shorts) (Pairs of shorts) 1,650 300 12 1,350 600 18 1,200 750 24 900 1,350 30 750 1,800 On the followirng graph, plot the demand for shorts using the blue point (circle symbol). Next, plot the supply of shorts using the orange point (square symbol). Finally, use the black point (plus symbol) to indicate the equilibrium price and quantity in the market for shorts. Note: Plot your points in the order in which you would like them connected. Line segments will connect the points automatically.

Chapter1: Introducing The Economic Way Of Thinking
Section1.A: Applying Graphs To Economics
Problem 2SQ

Related questions
Question
So it’s basically asking me to look at the plots of the grid?
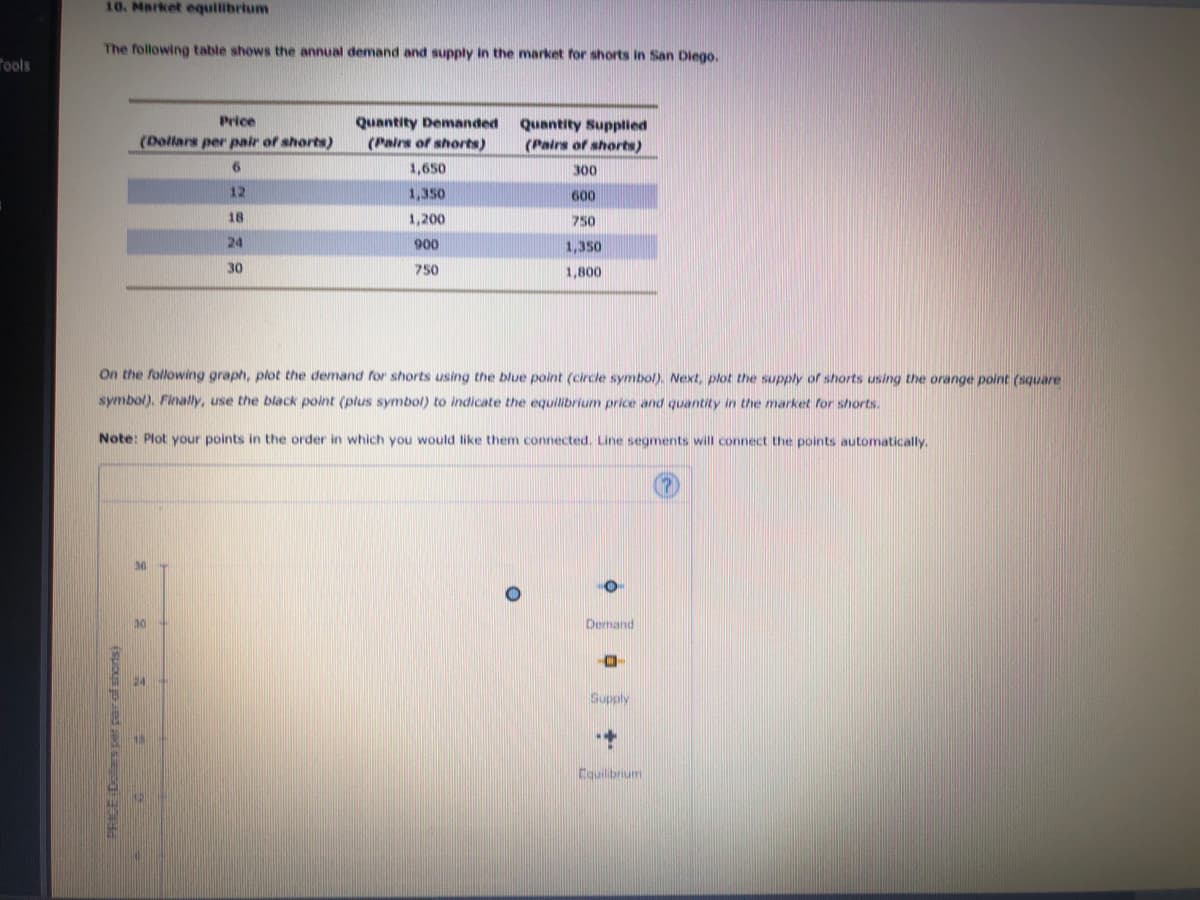
Transcribed Image Text:The following table shows the annual demand and supply in the market for shorts in San Diego.
Price
Quantity Demanded
(Palrs of shorts)
Quantity Supplied
(Dollars per pair of shorts)
(Pairs of shorts)
1,650
300
12
1,350
600
18
1,200
750
24
900
1,350
30
750
1,800
On the followirng graph, plot the demand for shorts using the blue point (circle symbol). Next, plot the supply of shorts using the orange point (square
symbol). Finally, use the black point (plus symbol) to indicate the equilibrium price and quantity in the market for shorts.
Note: Plot your points in the order in which you would like them connected. Line segments will connect the points automatically.
Expert Solution
This question has been solved!
Explore an expertly crafted, step-by-step solution for a thorough understanding of key concepts.

This is a popular solution!

Trending now
This is a popular solution!

Step by step
Solved in 2 steps with 1 images

Knowledge Booster


Learn more about
Need a deep-dive on the concept behind this application? Look no further. Learn more about this topic, economics and related others by exploring similar questions and additional content below.Recommended textbooks for you


Economics (MindTap Course List)
Economics
ISBN:
9781337617383
Author:
Roger A. Arnold
Publisher:
Cengage Learning
Economics (MindTap Course List)
Economics
ISBN:
9781337617383
Author:
Roger A. Arnold
Publisher:
Cengage Learning


