The following graph input tool shows the daily demand for hotel rooms at the Peacock Hotel and Casino in Las Vegas, Nevada. To help the hotel management better understand the market, an economist identified three primary factors that affect the demand for rooms each night. These demand factors, along with the values corresponding to the initial demand curve, are shown in the following table and alongside the graph input tool. Demand Factor Average American household income Initial Value $50,000 per year $200 per roundtrip $250 per night Roundtrip airfare from San Francisco (SFO) to Las Vegas (LAS) Room rate at the Grandiose Hotel and Casino, which is near the Peacock Use the graph input tool to help you answer the following questions. You will not be graded on any changes you make to this graph. Note: Once you enter a value in a white field, the graph and any corresponding amounts in each grey field will change accordingly. Graph Input Tool ? Market for Peacock's Hotel Rooms 500 450 Price 300 (Dollars per room) 400 Quantity 200 350 Demanded (Hotel rooms per night) 300 a 18 O
The following graph input tool shows the daily demand for hotel rooms at the Peacock Hotel and Casino in Las Vegas, Nevada. To help the hotel management better understand the market, an economist identified three primary factors that affect the demand for rooms each night. These demand factors, along with the values corresponding to the initial demand curve, are shown in the following table and alongside the graph input tool. Demand Factor Average American household income Initial Value $50,000 per year $200 per roundtrip $250 per night Roundtrip airfare from San Francisco (SFO) to Las Vegas (LAS) Room rate at the Grandiose Hotel and Casino, which is near the Peacock Use the graph input tool to help you answer the following questions. You will not be graded on any changes you make to this graph. Note: Once you enter a value in a white field, the graph and any corresponding amounts in each grey field will change accordingly. Graph Input Tool ? Market for Peacock's Hotel Rooms 500 450 Price 300 (Dollars per room) 400 Quantity 200 350 Demanded (Hotel rooms per night) 300 a 18 O

Chapter16: Labor Markets
Section: Chapter Questions
Problem 16.10P

Related questions
Question
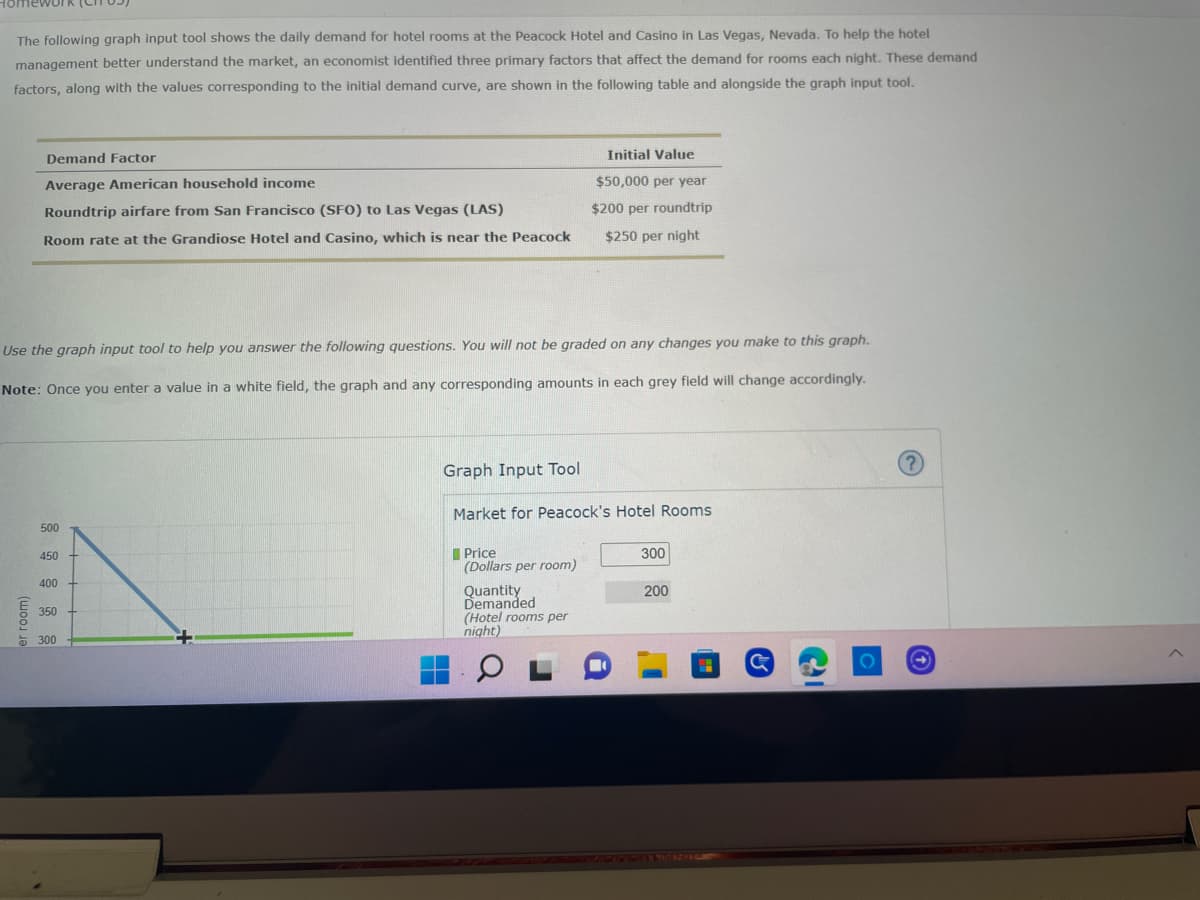
Transcribed Image Text:The following graph input tool shows the daily demand for hotel rooms at the Peacock Hotel and Casino in Las Vegas, Nevada. To help the hotel
management better understand the market, an economist identified three primary factors that affect the demand for rooms each night. These demand
factors, along with the values corresponding to the initial demand curve, are shown in the following table and alongside the graph input tool.
Demand Factor
Average American household income
Initial Value
$50,000 per year
$200 per roundtrip
Roundtrip airfare from San Francisco (SFO) to Las Vegas (LAS)
Room rate at the Grandiose Hotel and Casino, which is near the Peacock
$250 per night
Use the graph input tool to help you answer the following questions. You will not be graded on any changes you make to this graph.
Note: Once you enter a value in a white field, the graph and any corresponding amounts in each grey field will change accordingly.
Graph Input Tool
Market for Peacock's Hotel Rooms
500
450
Price
300
(Dollars per room)
400
Quantity
200
Demanded
350
(Hotel rooms per
night)
300
er room)
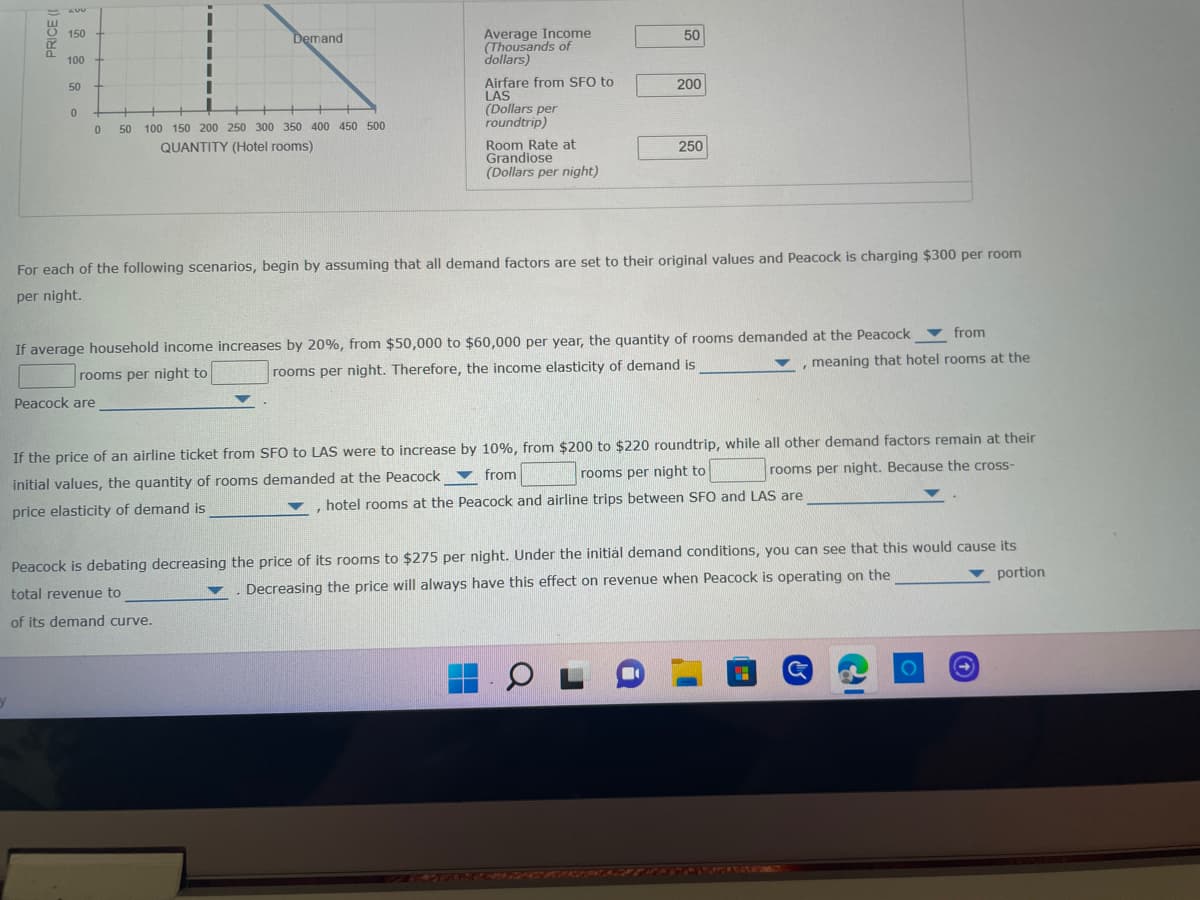
Transcribed Image Text:1200
150
100
50
0
PRICE (
Demand
50
Average Income
(Thousands of
dollars)
+
Airfare from SFO to
200
LAS
(Dollars per
0
50 100 150 200 250 300 350 400 450 500
roundtrip)
QUANTITY (Hotel rooms)
250
Room Rate at
Grandiose
(Dollars per night)
For each of the following scenarios, begin by assuming that all demand factors are set to their original values and Peacock is charging $300 per room
per night.
▼ from
If average household income increases by 20%, from $50,000 to $60,000 per year, the quantity of rooms demanded at the Peacock
rooms per night to
rooms per night. Therefore, the income elasticity of demand is
, meaning that hotel rooms at the
Peacock are
If the price of an airline ticket from SFO to LAS were to increase by 10%, from $200 to $220 roundtrip, while all other demand factors remain at their
rooms per night. Because the cross-
initial values, the quantity of rooms demanded at the Peacock from
price elasticity of demand is
rooms per night to
hotel rooms at the Peacock and airline trips between SFO and LAS are
"
Peacock is debating decreasing the price of its rooms to $275 per night. Under the initial demand conditions, you can see that this would cause its
portion
total revenue to
Decreasing the price will always have this effect on revenue when Peacock is operating on the
of its demand curve.
OL
G
Expert Solution
This question has been solved!
Explore an expertly crafted, step-by-step solution for a thorough understanding of key concepts.

This is a popular solution!

Trending now
This is a popular solution!

Step by step
Solved in 4 steps with 4 images

Knowledge Booster


Learn more about
Need a deep-dive on the concept behind this application? Look no further. Learn more about this topic, economics and related others by exploring similar questions and additional content below.Recommended textbooks for you

Microeconomics: Private and Public Choice (MindTa…
Economics
ISBN:
9781305506893
Author:
James D. Gwartney, Richard L. Stroup, Russell S. Sobel, David A. Macpherson
Publisher:
Cengage Learning

Economics: Private and Public Choice (MindTap Cou…
Economics
ISBN:
9781305506725
Author:
James D. Gwartney, Richard L. Stroup, Russell S. Sobel, David A. Macpherson
Publisher:
Cengage Learning
Microeconomics: Private and Public Choice (MindTa…
Economics
ISBN:
9781305506893
Author:
James D. Gwartney, Richard L. Stroup, Russell S. Sobel, David A. Macpherson
Publisher:
Cengage Learning
Economics: Private and Public Choice (MindTap Cou…
Economics
ISBN:
9781305506725
Author:
James D. Gwartney, Richard L. Stroup, Russell S. Sobel, David A. Macpherson
Publisher:
Cengage Learning

Macroeconomics: Private and Public Choice (MindTa…
Economics
ISBN:
9781305506756
Author:
James D. Gwartney, Richard L. Stroup, Russell S. Sobel, David A. Macpherson
Publisher:
Cengage Learning