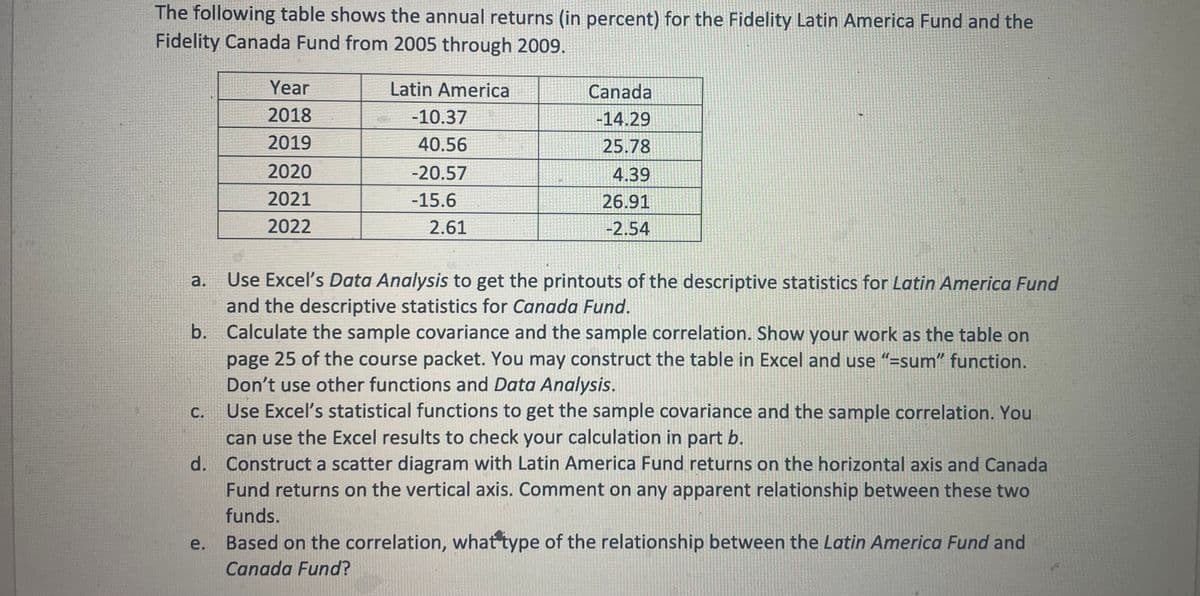
The following table shows the annual returns (in percent) for the Fidelity Latin America Fund and the Fidelity Canada Fund from 2005 through 2009. Latin America -10.37 40.56 -20.57 -15.6 a. Year 2018 2019 2020 2021 2022 C. 2.61 Canada -14.29 25.78 4.39 26.91 -2.54 o Use Excel's Data Analysis to get the printouts of the descriptive statistics for Latin America Fund and the descriptive statistics for Canada Fund. b. Calculate the sample covariance and the sample correlation. Show your work as the table on page 25 of the course packet. You may construct the table in Excel and use "=sum" function. Don't use other functions and Data Analysis. Use Excel's statistical functions to get the sample covariance and the sample correlation. You can use the Excel results to check your calculation in part b.
The following table shows the annual returns (in percent) for the Fidelity Latin America Fund and the Fidelity Canada Fund from 2005 through 2009. Latin America -10.37 40.56 -20.57 -15.6 a. Year 2018 2019 2020 2021 2022 C. 2.61 Canada -14.29 25.78 4.39 26.91 -2.54 o Use Excel's Data Analysis to get the printouts of the descriptive statistics for Latin America Fund and the descriptive statistics for Canada Fund. b. Calculate the sample covariance and the sample correlation. Show your work as the table on page 25 of the course packet. You may construct the table in Excel and use "=sum" function. Don't use other functions and Data Analysis. Use Excel's statistical functions to get the sample covariance and the sample correlation. You can use the Excel results to check your calculation in part b.

Glencoe Algebra 1, Student Edition, 9780079039897, 0079039898, 2018
18th Edition
ISBN:9780079039897
Author:Carter
Publisher:Carter
Chapter10: Statistics
Section10.4: Distributions Of Data
Problem 19PFA

Related questions
Question
Transcribed Image Text:The following table shows the annual returns (in percent) for the Fidelity Latin America Fund and the
Fidelity Canada Fund from 2005 through 2009.
Latin America
-10.37
40.56
-20.57
-15.6
a.
Year
2018
2019
C.
2020
2021
2022
e.
2.61
Canada
-14.29
25.78
4.39
26.91
-2.54
b. Calculate the sample covariance and the sample correlation. Show your work as the table on
page 25 of the course packet. You may construct the table in Excel and use "=sum" function.
Don't use other functions and Data Analysis.
Use Excel's Data Analysis to get the printouts of the descriptive statistics for Latin America Fund
and the descriptive statistics for Canada Fund.
Use Excel's statistical functions to get the sample covariance and the sample correlation. You
can use the Excel results to check your calculation in part b.
d. Construct a scatter diagram with Latin America Fund returns on the horizontal axis and Canada
Fund returns on the vertical axis. Comment on any apparent relationship between these two
funds.
Based on the correlation, what type of the relationship between the Latin America Fund and
Canada Fund?
Expert Solution
This question has been solved!
Explore an expertly crafted, step-by-step solution for a thorough understanding of key concepts.

This is a popular solution!

Trending now
This is a popular solution!

Step by step
Solved in 3 steps with 5 images

Recommended textbooks for you
Glencoe Algebra 1, Student Edition, 9780079039897…
Algebra
ISBN:
9780079039897
Author:
Carter
Publisher:
McGraw Hill

Holt Mcdougal Larson Pre-algebra: Student Edition…
Algebra
ISBN:
9780547587776
Author:
HOLT MCDOUGAL
Publisher:
HOLT MCDOUGAL
Glencoe Algebra 1, Student Edition, 9780079039897…
Algebra
ISBN:
9780079039897
Author:
Carter
Publisher:
McGraw Hill
Holt Mcdougal Larson Pre-algebra: Student Edition…
Algebra
ISBN:
9780547587776
Author:
HOLT MCDOUGAL
Publisher:
HOLT MCDOUGAL