mine the UCL and LCL for a X chart. (Roun

MATLAB: An Introduction with Applications
6th Edition
ISBN:9781119256830
Author:Amos Gilat
Publisher:Amos Gilat
Chapter1: Starting With Matlab
Section: Chapter Questions
Problem 1P

Related questions
Question
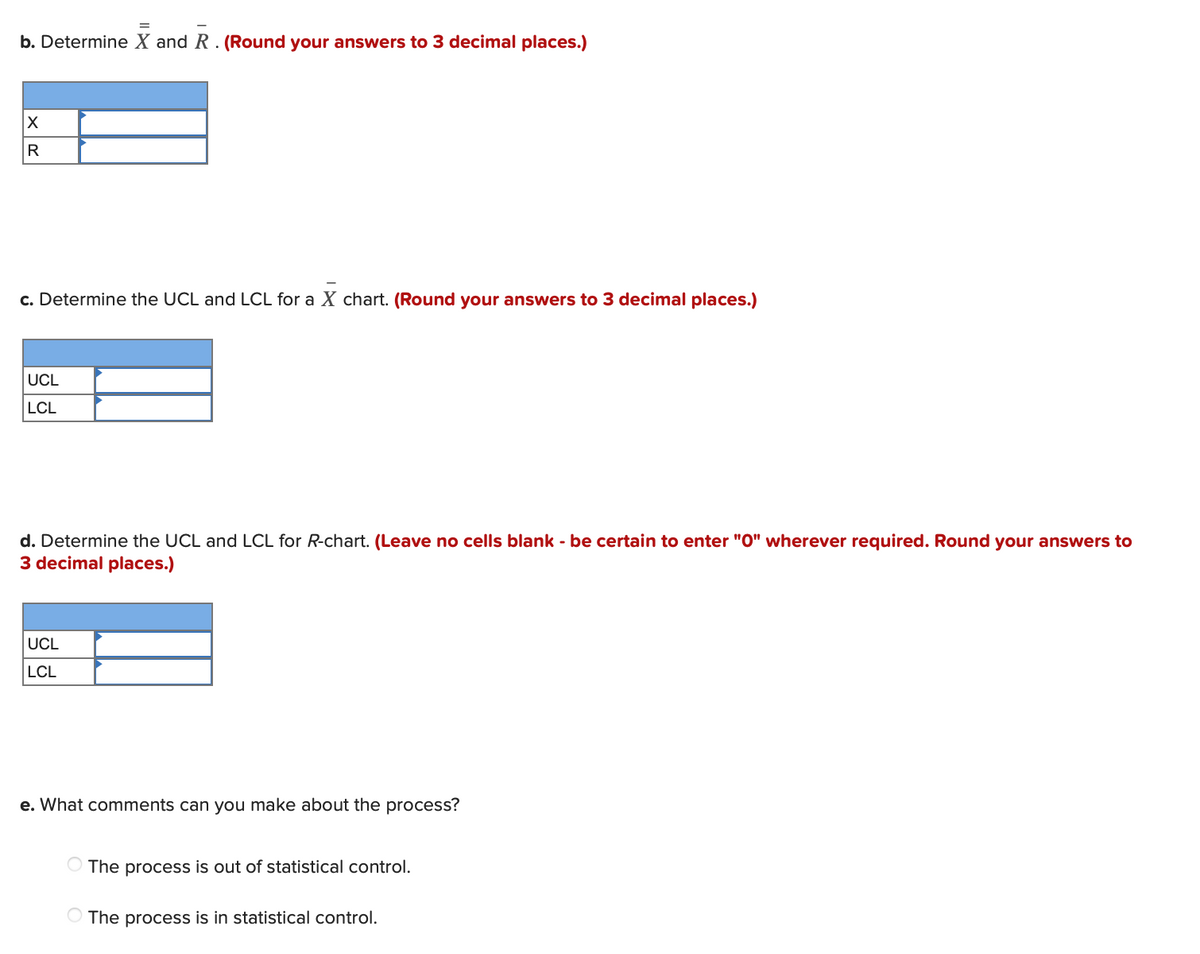
Transcribed Image Text:b. Determine X and R. (Round your answers to 3 decimal places.)
X
R
c. Determine the UCL and LCL for a X chart. (Round your answers to 3 decimal places.)
UCL
LCL
d. Determine the UCL and LCL for R-chart. (Leave no cells blank - be certain to enter "0" wherever required. Round your answers to
3 decimal places.)
UCL
LCL
e. What comments can you make about the process?
The process is out of statistical control.
The process is in statistical control.
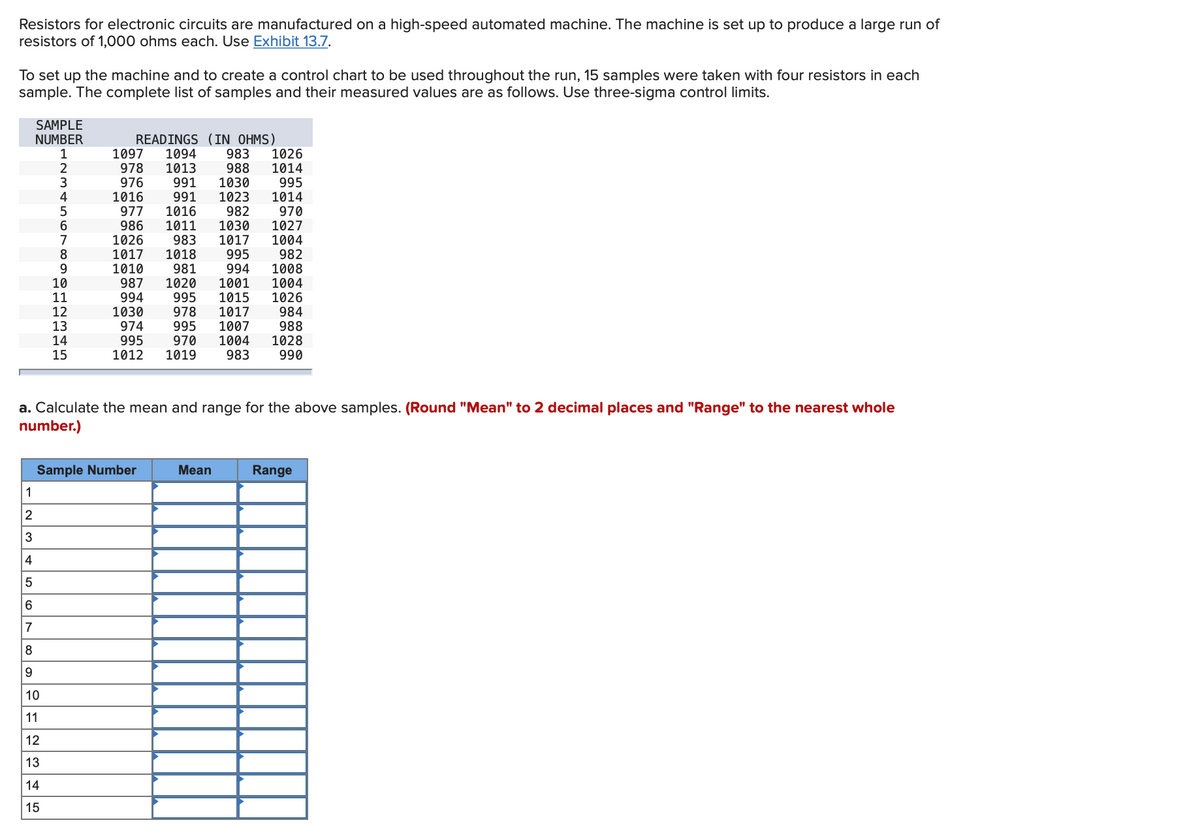
Transcribed Image Text:Resistors for electronic circuits are manufactured on a high-speed automated machine. The machine is set up to produce a large run of
resistors of 1,000 ohms each. Use Exhibit 13.7.
To set up the machine and to create a control chart to be used throughout the run, 15 samples were taken with four resistors in each
sample. The complete list of samples and their measured values are as follows. Use three-sigma control limits.
SAMPLE
NUMBER
1
2
3
4
5
6
7
8
9
10
11
12
13
1
2
3
4
5
6
7
8
9
10
11
12
13
14
15
14
15
READINGS (IN OHMS)
1026
1097 1094
978 1013
976
983
988
1014
995
991
1030
1016
991 1023 1014
977
1016
986 1011
982
1030
1026
983 1017
1017 1018 995
1010
982
981 994 1008
1020 1001 1004
995 1015
978 1017
1026
984
995 1007 988
970 1004 1028
1012 1019 983 990
987
994
1030
974
995
a. Calculate the mean and range for the above samples. (Round "Mean" to 2 decimal places and "Range" to the nearest whole
number.)
Sample Number
970
1027
1004
Mean
Range
Expert Solution
This question has been solved!
Explore an expertly crafted, step-by-step solution for a thorough understanding of key concepts.

Step by step
Solved in 3 steps with 1 images

Recommended textbooks for you
MATLAB: An Introduction with Applications
Statistics
ISBN:
9781119256830
Author:
Amos Gilat
Publisher:
John Wiley & Sons Inc

Probability and Statistics for Engineering and th…
Statistics
ISBN:
9781305251809
Author:
Jay L. Devore
Publisher:
Cengage Learning

Statistics for The Behavioral Sciences (MindTap C…
Statistics
ISBN:
9781305504912
Author:
Frederick J Gravetter, Larry B. Wallnau
Publisher:
Cengage Learning
MATLAB: An Introduction with Applications
Statistics
ISBN:
9781119256830
Author:
Amos Gilat
Publisher:
John Wiley & Sons Inc
Probability and Statistics for Engineering and th…
Statistics
ISBN:
9781305251809
Author:
Jay L. Devore
Publisher:
Cengage Learning
Statistics for The Behavioral Sciences (MindTap C…
Statistics
ISBN:
9781305504912
Author:
Frederick J Gravetter, Larry B. Wallnau
Publisher:
Cengage Learning

Elementary Statistics: Picturing the World (7th E…
Statistics
ISBN:
9780134683416
Author:
Ron Larson, Betsy Farber
Publisher:
PEARSON

The Basic Practice of Statistics
Statistics
ISBN:
9781319042578
Author:
David S. Moore, William I. Notz, Michael A. Fligner
Publisher:
W. H. Freeman

Introduction to the Practice of Statistics
Statistics
ISBN:
9781319013387
Author:
David S. Moore, George P. McCabe, Bruce A. Craig
Publisher:
W. H. Freeman