The following table shows the daily pocket expenses of 48 students of a college in rupees, calculate mean deviation, standard deviation and coefficient of variation. Daily Pocket Expenses No. of Students: 6. 7 8. 9. 10 11 12 3 6. 9 13 8 4
The following table shows the daily pocket expenses of 48 students of a college in rupees, calculate mean deviation, standard deviation and coefficient of variation. Daily Pocket Expenses No. of Students: 6. 7 8. 9. 10 11 12 3 6. 9 13 8 4

Glencoe Algebra 1, Student Edition, 9780079039897, 0079039898, 2018
18th Edition
ISBN:9780079039897
Author:Carter
Publisher:Carter
Chapter10: Statistics
Section10.4: Distributions Of Data
Problem 19PFA

Related questions
Question
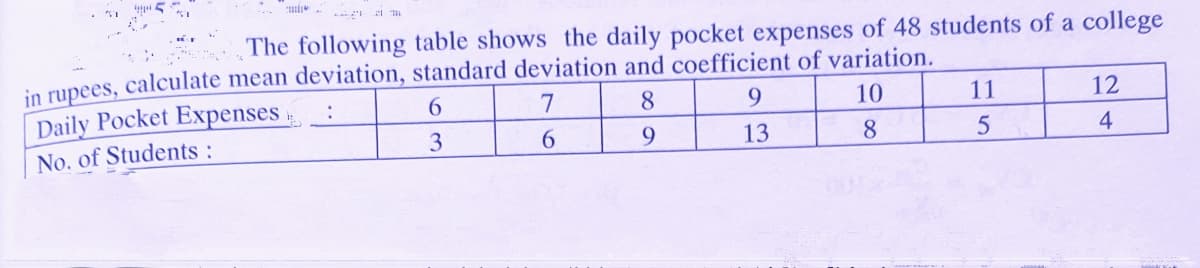
Transcribed Image Text:The following table shows the daily pocket expenses of 48 students of a college
in rupees, calculate mean deviation, standard deviation and coefficient of variation.
Daily Pocket Expenses
No. of Students:
6.
7
8.
9.
10
11
12
3
6.
9
13
8
Expert Solution
This question has been solved!
Explore an expertly crafted, step-by-step solution for a thorough understanding of key concepts.

This is a popular solution!

Trending now
This is a popular solution!

Step by step
Solved in 4 steps with 4 images

Recommended textbooks for you
Glencoe Algebra 1, Student Edition, 9780079039897…
Algebra
ISBN:
9780079039897
Author:
Carter
Publisher:
McGraw Hill
Glencoe Algebra 1, Student Edition, 9780079039897…
Algebra
ISBN:
9780079039897
Author:
Carter
Publisher:
McGraw Hill