The following two-way frequency table summarizes the results of a study done on a random sample of 1000 high-school students. The students were asked questions about their smoking status as well as their parents’ smoking habits and classified accordingly: Can we conclude that the parental smoking status and student smoking behavior are independent? (a = 0.01). Show all the steps of a hypothesis testing problem. Write the expected frequency of each cell in the table above.


Continuous Probability Distributions
Probability distributions are of two types, which are continuous probability distributions and discrete probability distributions. A continuous probability distribution contains an infinite number of values. For example, if time is infinite: you could count from 0 to a trillion seconds, billion seconds, so on indefinitely. A discrete probability distribution consists of only a countable set of possible values.
Normal Distribution
Suppose we had to design a bathroom weighing scale, how would we decide what should be the range of the weighing machine? Would we take the highest recorded human weight in history and use that as the upper limit for our weighing scale? This may not be a great idea as the sensitivity of the scale would get reduced if the range is too large. At the same time, if we keep the upper limit too low, it may not be usable for a large percentage of the population!
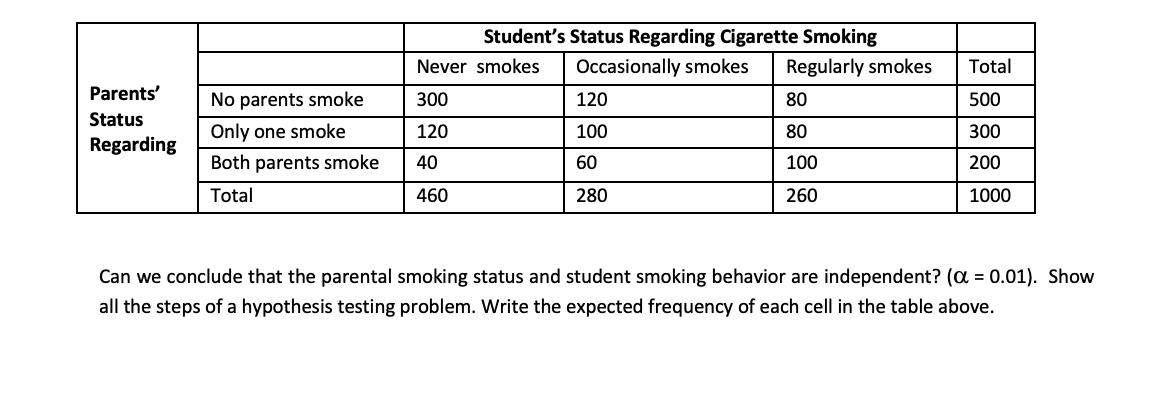
The following two-way frequency table summarizes the results of a study done on a random sample of 1000 high-school students. The students were asked questions about their smoking status as well as their parents’ smoking habits and classified accordingly:
Can we conclude that the parental smoking status and student smoking behavior are independent? (a = 0.01). Show all the steps of a hypothesis testing problem. Write the expected frequency of each cell in the table above.


Trending now
This is a popular solution!

Step by step
Solved in 5 steps


