The following graph shows the daily market for jeans when the tax on sellers is set at $0 per pair. Suppose the government institutes a tax of $40.60 per pair, to be paid by the seller. (Hint: To see the impact of the tax, enter the value of the tax in the Tax on Sellers field and move the green line to the after-tax equilibrium by adjusting the value in the Quantity field. Then, enter zero in the Tax on Sellers field. You should see a tax wedge between the price buyers pay and the price sellers receive.) Use the graph input tool to help you answer the following questions. You will not be graded on any changes you make to this graph. Note: Once you enter a value in a white field, the graph and any corresponding amounts in each grey field will change accordingly.
The following graph shows the daily market for jeans when the tax on sellers is set at $0 per pair. Suppose the government institutes a tax of $40.60 per pair, to be paid by the seller. (Hint: To see the impact of the tax, enter the value of the tax in the Tax on Sellers field and move the green line to the after-tax equilibrium by adjusting the value in the Quantity field. Then, enter zero in the Tax on Sellers field. You should see a tax wedge between the price buyers pay and the price sellers receive.) Use the graph input tool to help you answer the following questions. You will not be graded on any changes you make to this graph. Note: Once you enter a value in a white field, the graph and any corresponding amounts in each grey field will change accordingly.

Essentials of Economics (MindTap Course List)
8th Edition
ISBN:9781337091992
Author:N. Gregory Mankiw
Publisher:N. Gregory Mankiw
Chapter6: Supply, Demand And Government Policies
Section6.2: Taxes
Problem 2QQ

Related questions
Question
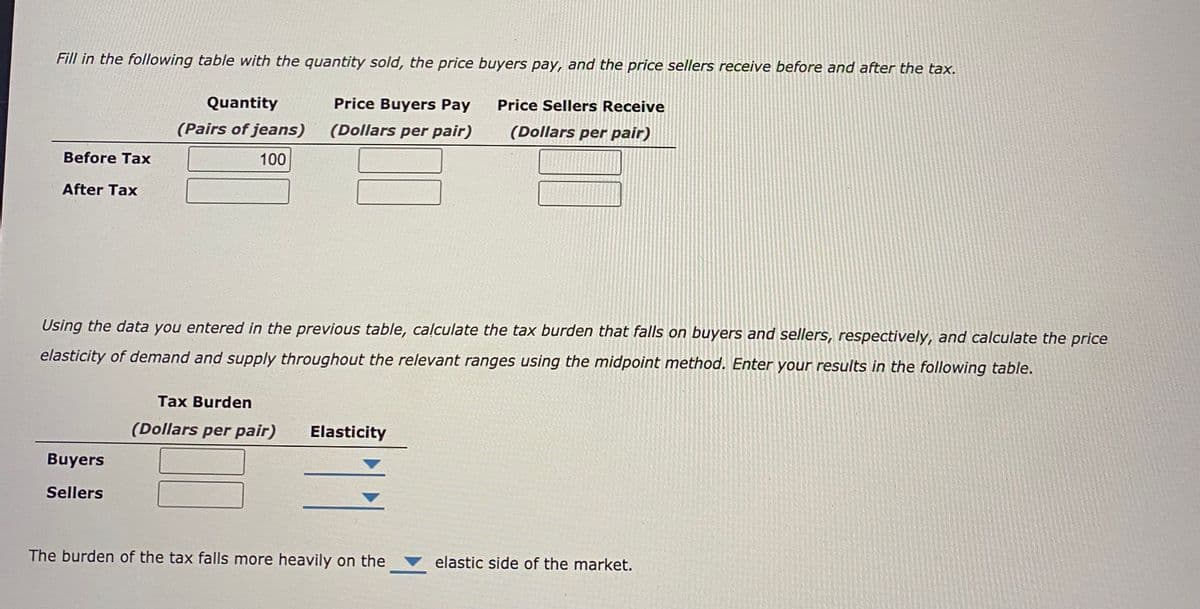
Transcribed Image Text:Fill in the following table with the quantity sold, the price buyers pay, and the price sellers receive before and after the tax.
Quantity
Price Buyers Pay
Price Sellers Receive
(Pairs of jeans)
(Dollars per pair)
(Dollars per pair)
Before Tax
100
After Tax
Using the data you entered in the previous table, calculate the tax burden that falls on buyers and sellers, respectively, and calculate the price
elasticity of demand and supply throughout the relevant ranges using the midpoint method. Enter your results in the following table.
Tax Burden
(Dollars per pair)
Elasticity
Buyers
Sellers
The burden of the tax falls more heavily on the
elastic side of the market.
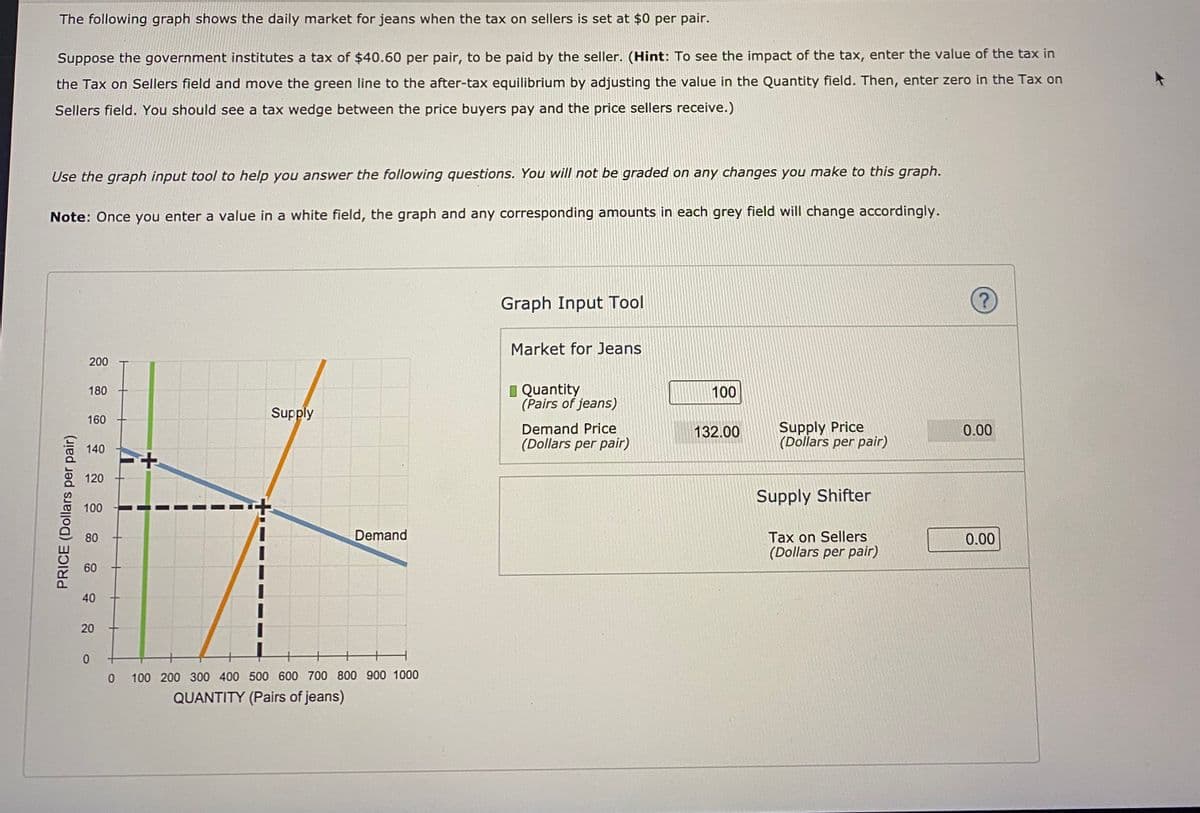
Transcribed Image Text:The following graph shows the daily market for jeans when the tax on sellers is set at $0 per pair.
Suppose the government institutes a tax of $40.60 per pair, to be paid by the seller. (Hint: To see the impact of the tax, enter the value of the tax in
the Tax on Sellers field and move the green line to the after-tax equilibrium by adjusting the value in the Quantity field. Then, enter zero in the Tax on
Sellers field. You should see a tax wedge between the price buyers pay and the price sellers receive.)
Use the graph input tool to help you answer the following questions. You will not be graded on any changes you make to this graph.
Note: Once you enter a value in a white field, the graph and any corresponding amounts in each grey field will change accordingly.
Graph Input Tool
Market for Jeans
200
I Quantity
(Pairs of jeans)
180
100
Supply
160
Demand Price
(Dollars per pair)
Supply Price
(Dollars per pair)
132.00
0.00
140
120
Supply Shifter
100
Demand
Tax on Sellers
(Dollars per pair)
80
0.00
60
40
20
100 200 300 400 500 600 700 800 900 1000
QUANTITY (Pairs of jeans)
PRICE (Dollars per pair)
Expert Solution
This question has been solved!
Explore an expertly crafted, step-by-step solution for a thorough understanding of key concepts.

This is a popular solution!

Trending now
This is a popular solution!

Step by step
Solved in 2 steps with 2 images

Follow-up Questions
Read through expert solutions to related follow-up questions below.
Follow-up Question

Transcribed Image Text:The following graph shows the daily market for jeans when the tax on sellers is set at $0 per pair.
Suppose the government institutes a tax of $11.60 per pair, to be paid by the seller. (Hint: To see the impact of the tax, enter the value of the tax in the
Tax on Sellers field and move the green line to the after-tax equilibrium by adjusting the value in the Quantity field. Then, enter zero in the Tax on Sellers
field. You should see a tax wedge between the price buyers pay and the price sellers receive.)
Use the graph input tool to help you answer the following questions. You will not be scored on any changes you make to this graph.
Note: Once you enter a value in a white field, the graph and any corresponding amounts in each grey field will change accordingly.
PRICE (Dollars per pair)
100
90
80
10
0
0
Demand
Supply
10 20 30 40 50 60 70 80 90 100
QUANTITY (Pairs of jeans)
Graph Input Tool
Market for Jeans
Quantity
(Pairs of jeans)
Demand Price
(Dollars per pair)
10
150.00
Supply Price
(Dollars per pair)
Supply Shifter
Tax on Sellers
(Dollars per pair)
34.00
0.00

Transcribed Image Text:Fill in the following table with the quantity sold, the price buyers pay, and the price sellers receive before and after the tax.
Price Buyers Pay
(Dollars per pair)
Price Sellers Receive
(Dollars per pair)
Before Tax
After Tax
Quantity
(Pairs of jeans)
0
Using the data you entered in the previous table, calculate the tax burden that falls on buyers and sellers, respectively, and calculate the price elasticity
of demand and supply throughout the relevant ranges using the midpoint method. Enter your results in the following table.
Buyers
Sellers
Tax Burden
(Dollars per pair)
Elasticity
The burden of the tax falls more heavily on the
elastic side of the market.
Solution
Recommended textbooks for you
Essentials of Economics (MindTap Course List)
Economics
ISBN:
9781337091992
Author:
N. Gregory Mankiw
Publisher:
Cengage Learning
Essentials of Economics (MindTap Course List)
Economics
ISBN:
9781337091992
Author:
N. Gregory Mankiw
Publisher:
Cengage Learning