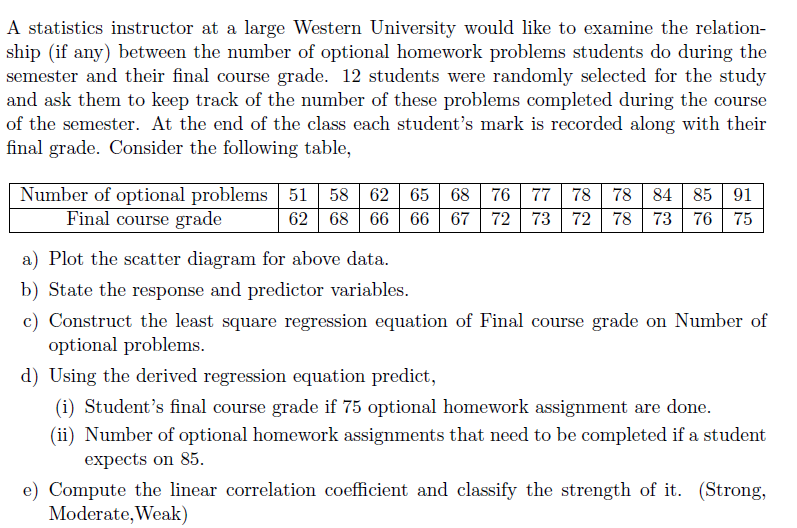
A statistics instructor at a large Western University would like to examine the relation- ship (if any) between the number of optional homework problems students do during the semester and their final course grade. 12 students were randomly selected for the study and ask them to keep track of the number of these problems completed during the course of the semester. At the end of the class each student's mark is recorded along with their final grade. Consider the following table, Number of optional problems 51 58 62 65 68 76 77 78 78 84 85 91 62 68 66 66 67 | 72 | 73 | 72 Final course grade 78 73 76 | 75 a) Plot the scatter diagram for above data. b) State the response and predictor variables. c) Construct the least square regression equation of Final course grade on Number of optional problems.
A statistics instructor at a large Western University would like to examine the relation- ship (if any) between the number of optional homework problems students do during the semester and their final course grade. 12 students were randomly selected for the study and ask them to keep track of the number of these problems completed during the course of the semester. At the end of the class each student's mark is recorded along with their final grade. Consider the following table, Number of optional problems 51 58 62 65 68 76 77 78 78 84 85 91 62 68 66 66 67 | 72 | 73 | 72 Final course grade 78 73 76 | 75 a) Plot the scatter diagram for above data. b) State the response and predictor variables. c) Construct the least square regression equation of Final course grade on Number of optional problems.

MATLAB: An Introduction with Applications
6th Edition
ISBN:9781119256830
Author:Amos Gilat
Publisher:Amos Gilat
Chapter1: Starting With Matlab
Section: Chapter Questions
Problem 1P

Related questions

Concept explainers
Equations and Inequations
Equations and inequalities describe the relationship between two mathematical expressions.
Linear Functions
A linear function can just be a constant, or it can be the constant multiplied with the variable like x or y. If the variables are of the form, x2, x1/2 or y2 it is not linear. The exponent over the variables should always be 1.
Question
100%
Can I have a detailed, step-by-step explanation for part (b) & part (c) of the following question?
Thank you very much!
Transcribed Image Text:A statistics instructor at a large Western University would like to examine the relation-
ship (if any) between the number of optional homework problems students do during the
semester and their final course grade. 12 students were randomly selected for the study
and ask them to keep track of the number of these problems completed during the course
of the semester. At the end of the class each student's mark is recorded along with their
final grade. Consider the following table,
Number of optional problems 51 58 62 65 68 76 77 78
Final course grade
78 84 85 91
62 68 66 66
67
72
73
72
78
73
76
75
a) Plot the scatter diagram for above data.
b) State the response and predictor variables.
c) Construct the least square regression equation of Final course grade on Number of
optional problems.
d) Using the derived regression equation predict,
(i) Student's final course grade if 75 optional homework assignment are done.
(ii) Number of optional homework assignments that need to be completed if a student
expects on 85.
e) Compute the linear correlation coefficient and classify the strength of it. (Strong,
Moderate,Weak)
Expert Solution
This question has been solved!
Explore an expertly crafted, step-by-step solution for a thorough understanding of key concepts.

Step by step
Solved in 4 steps with 4 images

Knowledge Booster


Learn more about
Need a deep-dive on the concept behind this application? Look no further. Learn more about this topic, statistics and related others by exploring similar questions and additional content below.Recommended textbooks for you
MATLAB: An Introduction with Applications
Statistics
ISBN:
9781119256830
Author:
Amos Gilat
Publisher:
John Wiley & Sons Inc

Probability and Statistics for Engineering and th…
Statistics
ISBN:
9781305251809
Author:
Jay L. Devore
Publisher:
Cengage Learning

Statistics for The Behavioral Sciences (MindTap C…
Statistics
ISBN:
9781305504912
Author:
Frederick J Gravetter, Larry B. Wallnau
Publisher:
Cengage Learning
MATLAB: An Introduction with Applications
Statistics
ISBN:
9781119256830
Author:
Amos Gilat
Publisher:
John Wiley & Sons Inc
Probability and Statistics for Engineering and th…
Statistics
ISBN:
9781305251809
Author:
Jay L. Devore
Publisher:
Cengage Learning
Statistics for The Behavioral Sciences (MindTap C…
Statistics
ISBN:
9781305504912
Author:
Frederick J Gravetter, Larry B. Wallnau
Publisher:
Cengage Learning

Elementary Statistics: Picturing the World (7th E…
Statistics
ISBN:
9780134683416
Author:
Ron Larson, Betsy Farber
Publisher:
PEARSON

The Basic Practice of Statistics
Statistics
ISBN:
9781319042578
Author:
David S. Moore, William I. Notz, Michael A. Fligner
Publisher:
W. H. Freeman

Introduction to the Practice of Statistics
Statistics
ISBN:
9781319013387
Author:
David S. Moore, George P. McCabe, Bruce A. Craig
Publisher:
W. H. Freeman