The graph shows the demand curve for smartphones and the supply curve of smartphones. Price (dollars per smartphone) Draw a point at the equilibrium price and quantity of smartphones. Label it 1. 500- Draw a curve that shows what happens in the market for smartphones if fewer firms produce smartphones but all other influences on selling plans remain the same. Label it S,. 400- Draw a point at the new equilibrium price and quantity. Label it 2. 300- 200- Do 100- Quantity (millions of smartphones per year) >>> Draw only the objects specified in the question.
The graph shows the demand curve for smartphones and the supply curve of smartphones. Price (dollars per smartphone) Draw a point at the equilibrium price and quantity of smartphones. Label it 1. 500- Draw a curve that shows what happens in the market for smartphones if fewer firms produce smartphones but all other influences on selling plans remain the same. Label it S,. 400- Draw a point at the new equilibrium price and quantity. Label it 2. 300- 200- Do 100- Quantity (millions of smartphones per year) >>> Draw only the objects specified in the question.

Chapter1: Making Economics Decisions
Section: Chapter Questions
Problem 1QTC

Related questions
Question
question 1
Transcribed Image Text:This question: 1 point(s) possible
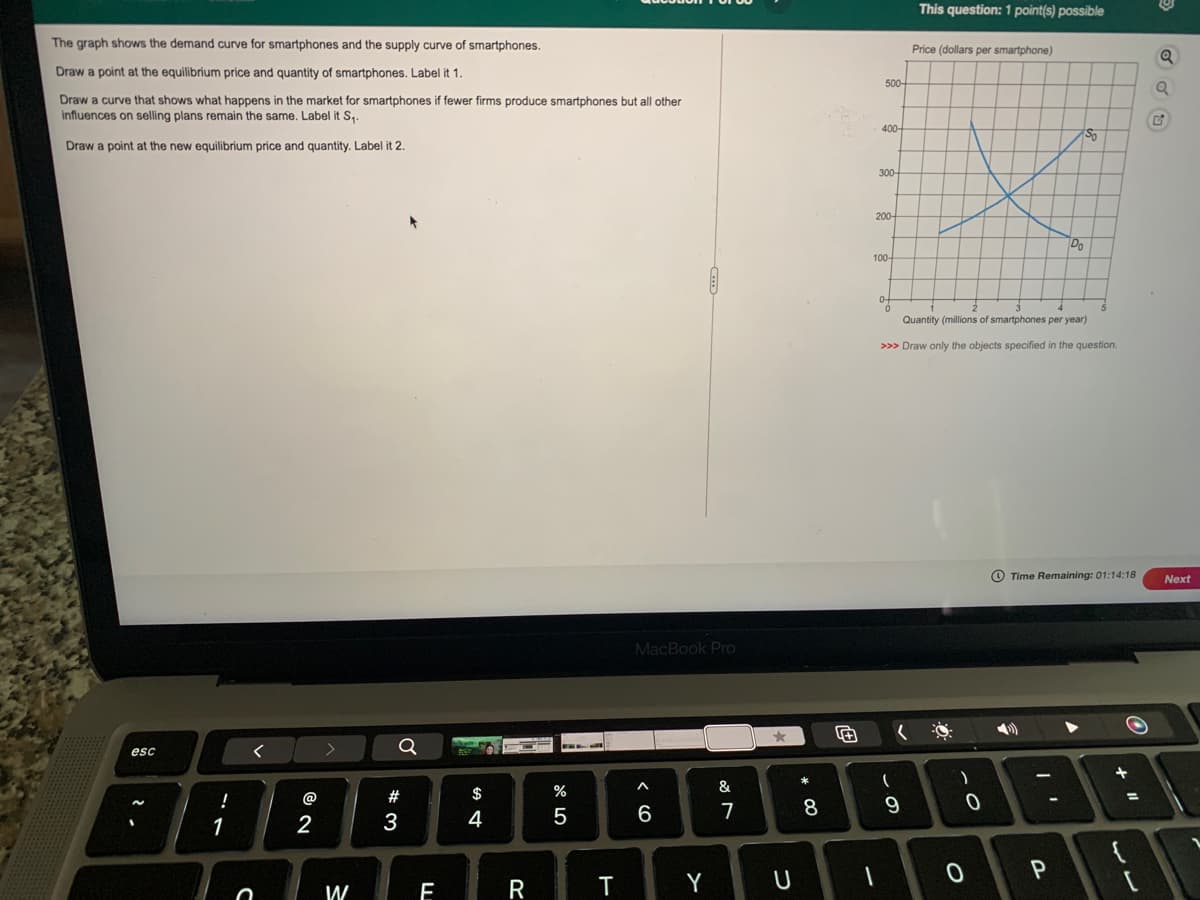
The graph shows the demand curve for smartphones and the supply curve of smartphones.
Price (dollars per smartphone)
Draw a point at the equilibrium price and quantity of smartphones. Label it 1.
500-
Draw a curve that shows what happens in the market for smartphones if fewer firms produce smartphones but all other
influences on selling plans remain the same. Label it S,.
400-
Draw a point at the new equilibrium price and quantity. Label it 2.
300-
200-
Do
100-
of
Quantity (millions of smartphones per year)
>>> Draw only the objects specified in the question.
O Time Remaining: 01:14:18
Next
MacBook Pro
Q
esc
B888
@
#
$
%
6
7
8.
9
1
2
3
4
W
E
R
Y
Expert Solution
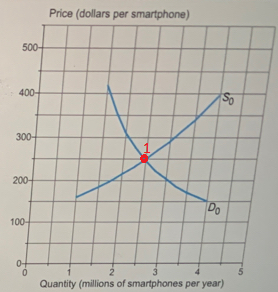
Step 1
Equilibrium price and quantity of smartphones will occur at a point where demand curve of smartphones i.e. D0 as per the figure given in question intersects the supply curve of smartphones i.e. S0 as per the figure given in question. This equilibrium point is labelled as 1 in the figure attached below:

Trending now
This is a popular solution!

Step by step
Solved in 2 steps with 3 images

Knowledge Booster


Learn more about
Need a deep-dive on the concept behind this application? Look no further. Learn more about this topic, economics and related others by exploring similar questions and additional content below.Recommended textbooks for you

Principles of Economics (12th Edition)
Economics
ISBN:
9780134078779
Author:
Karl E. Case, Ray C. Fair, Sharon E. Oster
Publisher:
PEARSON

Engineering Economy (17th Edition)
Economics
ISBN:
9780134870069
Author:
William G. Sullivan, Elin M. Wicks, C. Patrick Koelling
Publisher:
PEARSON
Principles of Economics (12th Edition)
Economics
ISBN:
9780134078779
Author:
Karl E. Case, Ray C. Fair, Sharon E. Oster
Publisher:
PEARSON
Engineering Economy (17th Edition)
Economics
ISBN:
9780134870069
Author:
William G. Sullivan, Elin M. Wicks, C. Patrick Koelling
Publisher:
PEARSON

Principles of Economics (MindTap Course List)
Economics
ISBN:
9781305585126
Author:
N. Gregory Mankiw
Publisher:
Cengage Learning

Managerial Economics: A Problem Solving Approach
Economics
ISBN:
9781337106665
Author:
Luke M. Froeb, Brian T. McCann, Michael R. Ward, Mike Shor
Publisher:
Cengage Learning

Managerial Economics & Business Strategy (Mcgraw-…
Economics
ISBN:
9781259290619
Author:
Michael Baye, Jeff Prince
Publisher:
McGraw-Hill Education