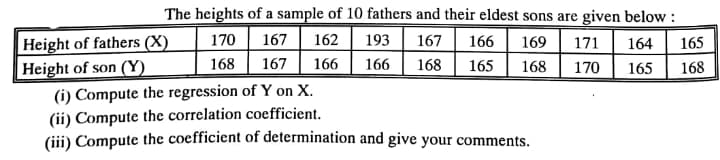
The heights of a sample of 10 fathers and their eldest sons are given below : 167 162 Height of fathers (X) Height of son (Y) (i) Compute the regression of Y on X. (ii) Compute the correlation coefficient. (ii) Compute the coefficient of determination and give your comments. 170 193 167 166 169 171 164 165 168 167 166 166 168 165 168 170 165 168


Q: The following data were collected during a study of consumer buying patterns: Observation y 1 15 74…
A: (1) Use EXCEL to construct the scatter plot. EXCEL procedure: Go to EXCEL Go to Insert menu…
Q: The results of a sample of 7 data points are presented below in terms of the Average Daily…
A: Given data: Average daily temperature (x) Average monthly precipitation (y) 86 3.4 81 1.8…
Q: In exercise 7 a sales manager collected the following data on x = annual sales and y = years of…
A: It is given that x and y are defined as annual sales and years of experience, respectively. The…
Q: The grades of a tutorial class of 8 students on midterm report and final examination are as shown…
A: We want to find mean of Y and X , Sx and Sy ,Pearson correlation Note:According to bartleby experts…
Q: sider the following data for a dependent variable y and two independent variables, x, and x,. X1 x2…
A: Solution: Given information: n= 10 observation k= 2 independent variables SST = 14995.6 SSR=…
Q: Consider the following dataset. S.No. Y 1 X 1.00 50.00 12.00 _2,00 66.00 18.00…
A: Note :“Since you have posted a question with multiple sub-parts, we will solve first three subparts…
Q: Consider the following data for a dependent variable y and two independent variables, ¤1 and x2. 30…
A: Procedure to conduct regression analysis using Excel: Enter the data of y, x1, and x2 (in different…
Q: The final test and exam averages for 20 randomly selected students taking a course in engineering…
A: Since you have posted a question with multiple sub-parts, we will solve first three sub- parts for…
Q: The following sample is collected as a conclusion of an observation: |2 3 47.3 66.7 4 6. 7 9 10 |Y…
A: The following equation is given in the question Now, Enter this data into Excel Taking log of Y…
Q: For a sample of 8 employees, a personnel director has collected the following data on ownership of…
A: As per our guidelines we can solve first three subpart and rest can be reposted. Solution-: X=Years…
Q: 5) Annual precipitation depths measured at 2 nearby flow observation stations are given below. a)…
A: Given data, X Y X*Y X*X Y*Y 172 195 33540 29584 38025 210 252 52920 44100 63504 244 241…
Q: A manufacturer of optical lenses has the following data on the cost per unit of a certain custom…
A:
Q: The data resulting from a random sample of 5 observations are shown below. Y is the dependent…
A: Since you have posted a question with multiple sub-parts, we will solve the first three subpartsfor…
Q: What is the equation of the regression line?
A: Answer:
Q: 139 264 278 470 569 304 675 271 162 Y 94 222 241 428 500 275 394 232 | 133 а) Compute the…
A: x y u v u2 v2 uv 139 94 -361 -406 130321 164836 146566 264 222 -236 -278 55696 77284 65608 278…
Q: 1. Consider the following data of the number of hours 12 students spent online during the weekend…
A: (a) Use EXCEL to obtain the value correlation coefficient r: EXCEL procedure: Go to EXCEL Go…
Q: Given are five observations for two variables, z and y. Excel File: data14-17.xisx z, | 2 6 9 13 20…
A: Given: x y 2 7 6 18 9 9 13 26 20 23
Q: The following table presents data from a solar energy project: X (Deflexión) Y (Flujo de Calor)…
A: Hello thanks for your question. Since you have posted a question with multiple sub-parts, I will…
Q: You are to analyze the given data from the records of ten students from AMAT167 last school year. 9|…
A: Instruction : "Answer items (a) and (b) only" Given Data : X = Midterm score Y = Final standing…
Q: The following are the number of grams of water and the number of grams of carbohydrates for a random…
A: X:- 83.93, 80.76, 87.66, 85.20, 72.85, 84.61, 83.61 Y:- 15.25, 16.55, 11.10, 13.01, 24.27, 14.13,…
Q: the average gasoline price per gallon (in cities) and the cost of a barrel of oil are shown below…
A: Correlation coefficient measures the strength and direction of the linear relationship between two…
Q: Consider the following data for a dependent variable y and two independent variables, ¤1 and #2. 30…
A: Procedure to perform regression analysis using Excel: Enter the data of y, x1, and x2 (in different…
Q: The following table shows the average number of hours per night sleeping by seven men and their…
A: The sleeping hours per night of the father(x) and the sleeping hours per night of the youngest child…
Q: Consider the following data for a dependent variable y and two independent variables, x, and x,. X1…
A: The statistical software output for this problem is given below: Hence,a) Hypotheses: Option C…
Q: 2. A. Try calculating for the regression equation and the correlation coefficient of the following…
A: The correlation coefficient and the regression does not change with the unit of the variables as…
Q: The following table shows the number of fiber optic cable connections to homes in a country from…
A:
Q: The following table gives the ages and blood pressure of 9 women. Age (X) : 56 42 36 47 49 42 60 72…
A: From given data, X Y X*Y X*X Y*Y 56 147 8232 3136 21609 42 125 5250 1764 15625 36 118 4248…
Q: 1. For the sample data Scatter Plot 10 9 8 7 4. 3 1 1 5 7 8. 1 3 5 8 y 2 4 6 a. Based on the scatter…
A: a. Scatterplot is a graphical representation between two variables, where each of the points of the…
Q: The grades of a class of 9 students on a midterm report (x) and on the final examination (y) are as…
A: Note: Hi there! Thank you for posting the question. As there are multiple sub parts, according to…
Q: The heights of a sample of 10 fathers and their eldest sons are given below : Height of fathers (X)…
A: Here, Height given for 10 samples of father and son. We have to calculate regression equation,…
Q: The following table shows, for a sample of towns in Great Britain, the number of solicitors, x, and…
A: As per our guidelines, we are allowed to answer first three sub-parts. Thanks Given Data : X Y…
Q: Suppose a car is chosen at random. Let x be the weight of the car (in hundreds of pounds), and let y…
A: Given the data- X Y XY X2 Y2 27 30 810 729 900 44 19 836 1936 361 32 24 768 1024 576 47…
Q: 1. Based on the data shown below, calculate the regression line (each value to at least two decimal…
A: According to our company guidelines if multiple questions are posted then I must do only one…
Q: Consider the following data for a dependent variable y and two independent variables, z and z; for…
A: There are two independent variables which are x1 and x2. The dependent variable is y. This is…
Q: The data is given as follow. xi 2 6 9 13 20 Vi 7 18 9 26 23 The estimated regression equation for…
A: The given regression equation is y-hat = 7.6 + 0.9 x.Required calculations for finding SSE, SST and…
Q: Given the following data set, 10 8 13 9 11 14 6 4 12 7 5 9.14 8.14 8.74 8.77…
A: Let the fitted line be yi^=a^+b^xi.Then,b^=n∑i=1nxiyi-∑i=1nxi∑i=1nyin∑i=1nxi2-∑i=1nxi2 and…
Q: The following table gives the ages and blood pressure of 9 women. Age (X) : 56 42 36 47 49 42 60 72…
A: From given data, X Y X*Y X*X Y*Y 56 147 8232 3136 21609 42 125 5250 1764 15625 36 118 4248…
Q: The following are the number of grams of water and the number of grams of carbohydrates for a random…
A: Since you have asked multiple subparts, we will solve first three subparts for you. To get remaining…
Q: Consider the following data for a dependent variable y and two independent variables, x1 and x2. x1…
A: The F-test is used to test the significance of the relationship between the variables. The test…
Q: The table below summarizes x and y values. Find the sample correlation coefficient, rxy using the…
A: The data shows the x and y values to calculate the sample correlation coefficient.
Q: 4. Predict Y when X1 = 94.8 and X2 = 11.2. Yhat = . 5. While testing for overall significance at…
A: It is asked to predict the value of Y when X1 = 94.8 and X2 = 11.2. That is , Y hat is required…
Q: Consider the following data for a dependent variable y and two independent variables, ¤1 and ¤2. 30…
A: Assume that β1 is the slope coefficient of corresponding x2.
Q: Consider the following data on y = number of songs stored on an MP3 player and x = number of months…
A: Regression Equation: Excel Procedure: Enter X and Y in Excel>Data>Data Analysis>…
Q: a) Given the data below on students' scores, derive the regression equation b) Calculate Spearman's…
A:
Q: Consider the following data for a dependent variable y and two independent variables, X1 and X2. X1…
A: There are two independent variables which are named as x1 and x2. The dependent variable is y. We…
Q: Consider the following dataset. S.No. Y 50.00 12.00 66.00 18.00 61.00 16.23 79.00 32.06 52.00 17.00…
A: Since you have asked multiple questions, we will solve first three subparts for you. To get…
Q: The following table lists the midterm and final exam scores for seven students in a statistics…
A: In this case, final exam scores is predicted on the basis of midterm exam scores. The final exam…
Q: Calculate the co-efficient of correlation and the lines of regression for the following data: 1 2 3…
A:
Q: A researcher intends to conduct a multiple regression on the following data set where YY is the…
A:


Trending now
This is a popular solution!

Step by step
Solved in 2 steps with 2 images

- 4. For a sample of 12 observations, a businessman wants to regress the price (in dollar) of the laptop (Y) on the processor's speed (X). The summary results of the observations are given below. Σx = 19.8 , Σy = 24798, Σxy = 431882 Σx^2 = 3388, Σγ^2 = 57365692 a) compute correlation coefficient (b) Find the fitted regression line of the price of laptop on processor speed.The ages (X) of ten second-hand cars and their km values (Y) are given below.a) Calculate the correlation coefficient between X and Y.b) Calculate the coefficients of the regression line of the Y with respect to X.c) Estimate the km value of a 5.0 year old car. X and Y values given in the picture.A sample of n = 15 pairs of X and Y scores produces a Pearson correlation of r = 0.45, SSY = 90. a) If the regression equation was found for these scores, how much of the Y variability would be predicted by the regression equation (SSregression) and how much would not be predicted (SSresidual)? b) Does the regression equation predict a significant portion of the variability for the Y scores? (Equivalently, is the Pearson correlation significant?)
- Listed below are the overhead widths (in cm) of seals measured from photographs and the weights (in kg) of the seals. Construct a scatterplot, find the value of the linear correlation coefficient r, and find the critical values of r using alpha equals 0.05. Is there sufficient evidence to conclude that there is a linear correlation between overhead widths of seals from photographs and the weights of theseals? Overhead Width 7.1 7.6 9.7 9.3 8.6 8.2 Weight 115 197 243 198 197 186The average gasoline price per gallon (in cities) and the cost of a barrel of oil are shown below for a random selection of weeks in 2015 . Oil ( $ ) Gasoline ( $ ) 47.79 2.638 44.62 2.636 81.08 2.944 43.67 2.528 40.58 2.623 48.64 2.682 The correlation coefficient for the data is =r0.954 and =α0.01. Should regression analysis be done? Find the equation of the regression line. Round the coefficients to at least three decimal places. =y′+abx =a =b Find the cost of gasoline when oil is $57 a barrel. Round the answer to at least three decimal places. When oil is $57 a barrel, gas costs $ per gallon.Listed below are the overhead widths (in cm) of seals measured from photographs and the weights (in kg) of the seals. Construct a scatterplot, find the value of the linear correlation coefficient r, and find the critical values of r using α=0.01. Overhead width overhead weight 7.1 111 7.6 164 9.8 250 9.2 192 8.8 205 8.2 183 Is there sufficient evidence to conclude that there is a linear correlation between overhead widths of seals from photographs and the weights of the seals? The linear correlation coefficient is r=? (Round to three decimal places as needed.) The linear correlation coefficient is r=? (Round to three decimal places as needed.) The critical values are r=? (Round to three decimal places as needed. Use a comma to separate answers as needed.) Because the absolute value of the linear correlation coefficient is ______ than the positive critical value, there _______ sufficient evidence to support the claim that there is a linear…
- The following data gives the information on the ages (in years) and the number of breakdownsduring the past month for a sample of 7 machines at a large industrial company.Age (X) 12 7 2 8 13 9 4Number of breakdowns (Y) 9 5 1 4 11 7 2(a) Draw a scatter diagram to represent the above data.(b) Calculate the value of Pearson’s correlation coefficient r. Interpret the value of r.(c) Calculate coefficient of determination. Interpret your answer.(d) Determine the equation of the regression line using least squares method.(e) What is the expected breakdown for an eleven year old machine?Listed below are the overhead widths (in cm) of seals measured from photographs and the weights (in kg) of the seals. Construct a scatterplot, find the value of the linear correlation coefficient r, and find the critical values of r using α=0.05. Is there sufficient evidence to conclude that there is a linear correlation between overhead widths of seals from photographs and the weights of the seals? Overhead Width 7.1 7.6 9.6 9.2 8.7 8.2 Weight 113 173 242 192 200 188 PLOTS INSERTED AS PICTURE The linear correlation coefficient is r=________. (Round to three decimal places as needed.) The critical values are r=________. (Round to three decimal places as needed. Use a comma to separate answers as needed.) Because the absolute value of the linear correlation coefficient is ▼ less greater than the positive critical value, there ▼ is not is sufficient evidence to support the claim that there is a…In a partially destroyed laboratory, record of an analysis of correlation, data, the following results only are legible:Variance of X=9. Regression equation: 8X –10Y + 66=0, 40X–18Y = 214.(1) the mean value X and Y,(2) the correlation coefficient between X and Y, and (3) the standard deviation of Y ?
- Compute for the necessary correlational analysis based on the given data. The following data, adapted from Montgomery, Peck, and Vining (2001), present the number of certified mental defectives per 10,000 of estimated population in the United Kingdom ( y) and the number of radio receiver licenses issued (x) by the BBC (in millions) for the years 1924 through 1937. Fit a regression model relating y and x. Comment on the model. Specifically, does the existence of a strong correlation imply a cause-and-effect relationship?From the data of the following table: Calculate Spearman's rank correlation coefficient between x and y and determine its type. sHere is a bivariate data set. x y -2.6 120.6 30.5 34.9 40.1 85.3 18.2 82.2 14.8 89.6 21.8 69.3 36.3 49.9 49.1 25.7 32.3 56.6 52.2 -8.4 Use technology to find the correlation coefficient and report it accurate to three decimal places.